threat-trace
agentic defense, in your browser
A working log-analysis demo: three synthetic streams, model-generated hints, and checks you can inspect. One self-contained HTML file. No install or server required.
The attackers running coordinated campaigns against your stack right now are multi-step, multi-stream, adaptive. They probe the edge, pivot to the identity tier when the WAF slows them down, rotate IPs, exploit legacy allowlists DevOps quietly accepted years ago. They orchestrate.
Defenders' AI tooling is mostly: paste a log into a chat AI, ask "what stands out?" That's a single-completion analyst on a specialty task. It's not a defense system. It misses the bypasses (one stream looks clean, another floods without context, the truth lives between them). It hallucinates correlations (two unrelated 4xx events in the same time window get bundled into the wrong narrative). It can't show its work in a post-mortem.
threat-trace starts with three synthetic log streams: an edge tier (CDN / WAF), an identity tier (logins), and an API tier (application traffic). The current demo parses each stream, asks a model for hints about that stream, and checks those hints against fixture expectations. One check asks whether routine token-expiration 401s have been mistaken for malicious activity.
Demo scope checked October 7, 2026: Phases 1 and 2 provide per-stream hints, expectation panels, and provenance from each hint through parsed events to raw log lines. Phase 3 — stream summaries, cross-stream correlation, ranked actions, and the action trace explorer — is staged in the source repository and is not available in the shipped demo. The source release notes describe that boundary.
The fixture data ships in three well-documented public log shapes (Cloudflare GraphQL Analytics for the edge tier, Auth0 tenant logs for the identity tier, Azure App Insights AppRequest for the api tier) because those are the most reviewable starting points. The parser contract is vendor-agnostic — swap in Fastly / Akamai / CloudFront, Okta / Cognito / Keycloak / Entra ID, or OpenTelemetry-style application logging without touching anything above the parsers.
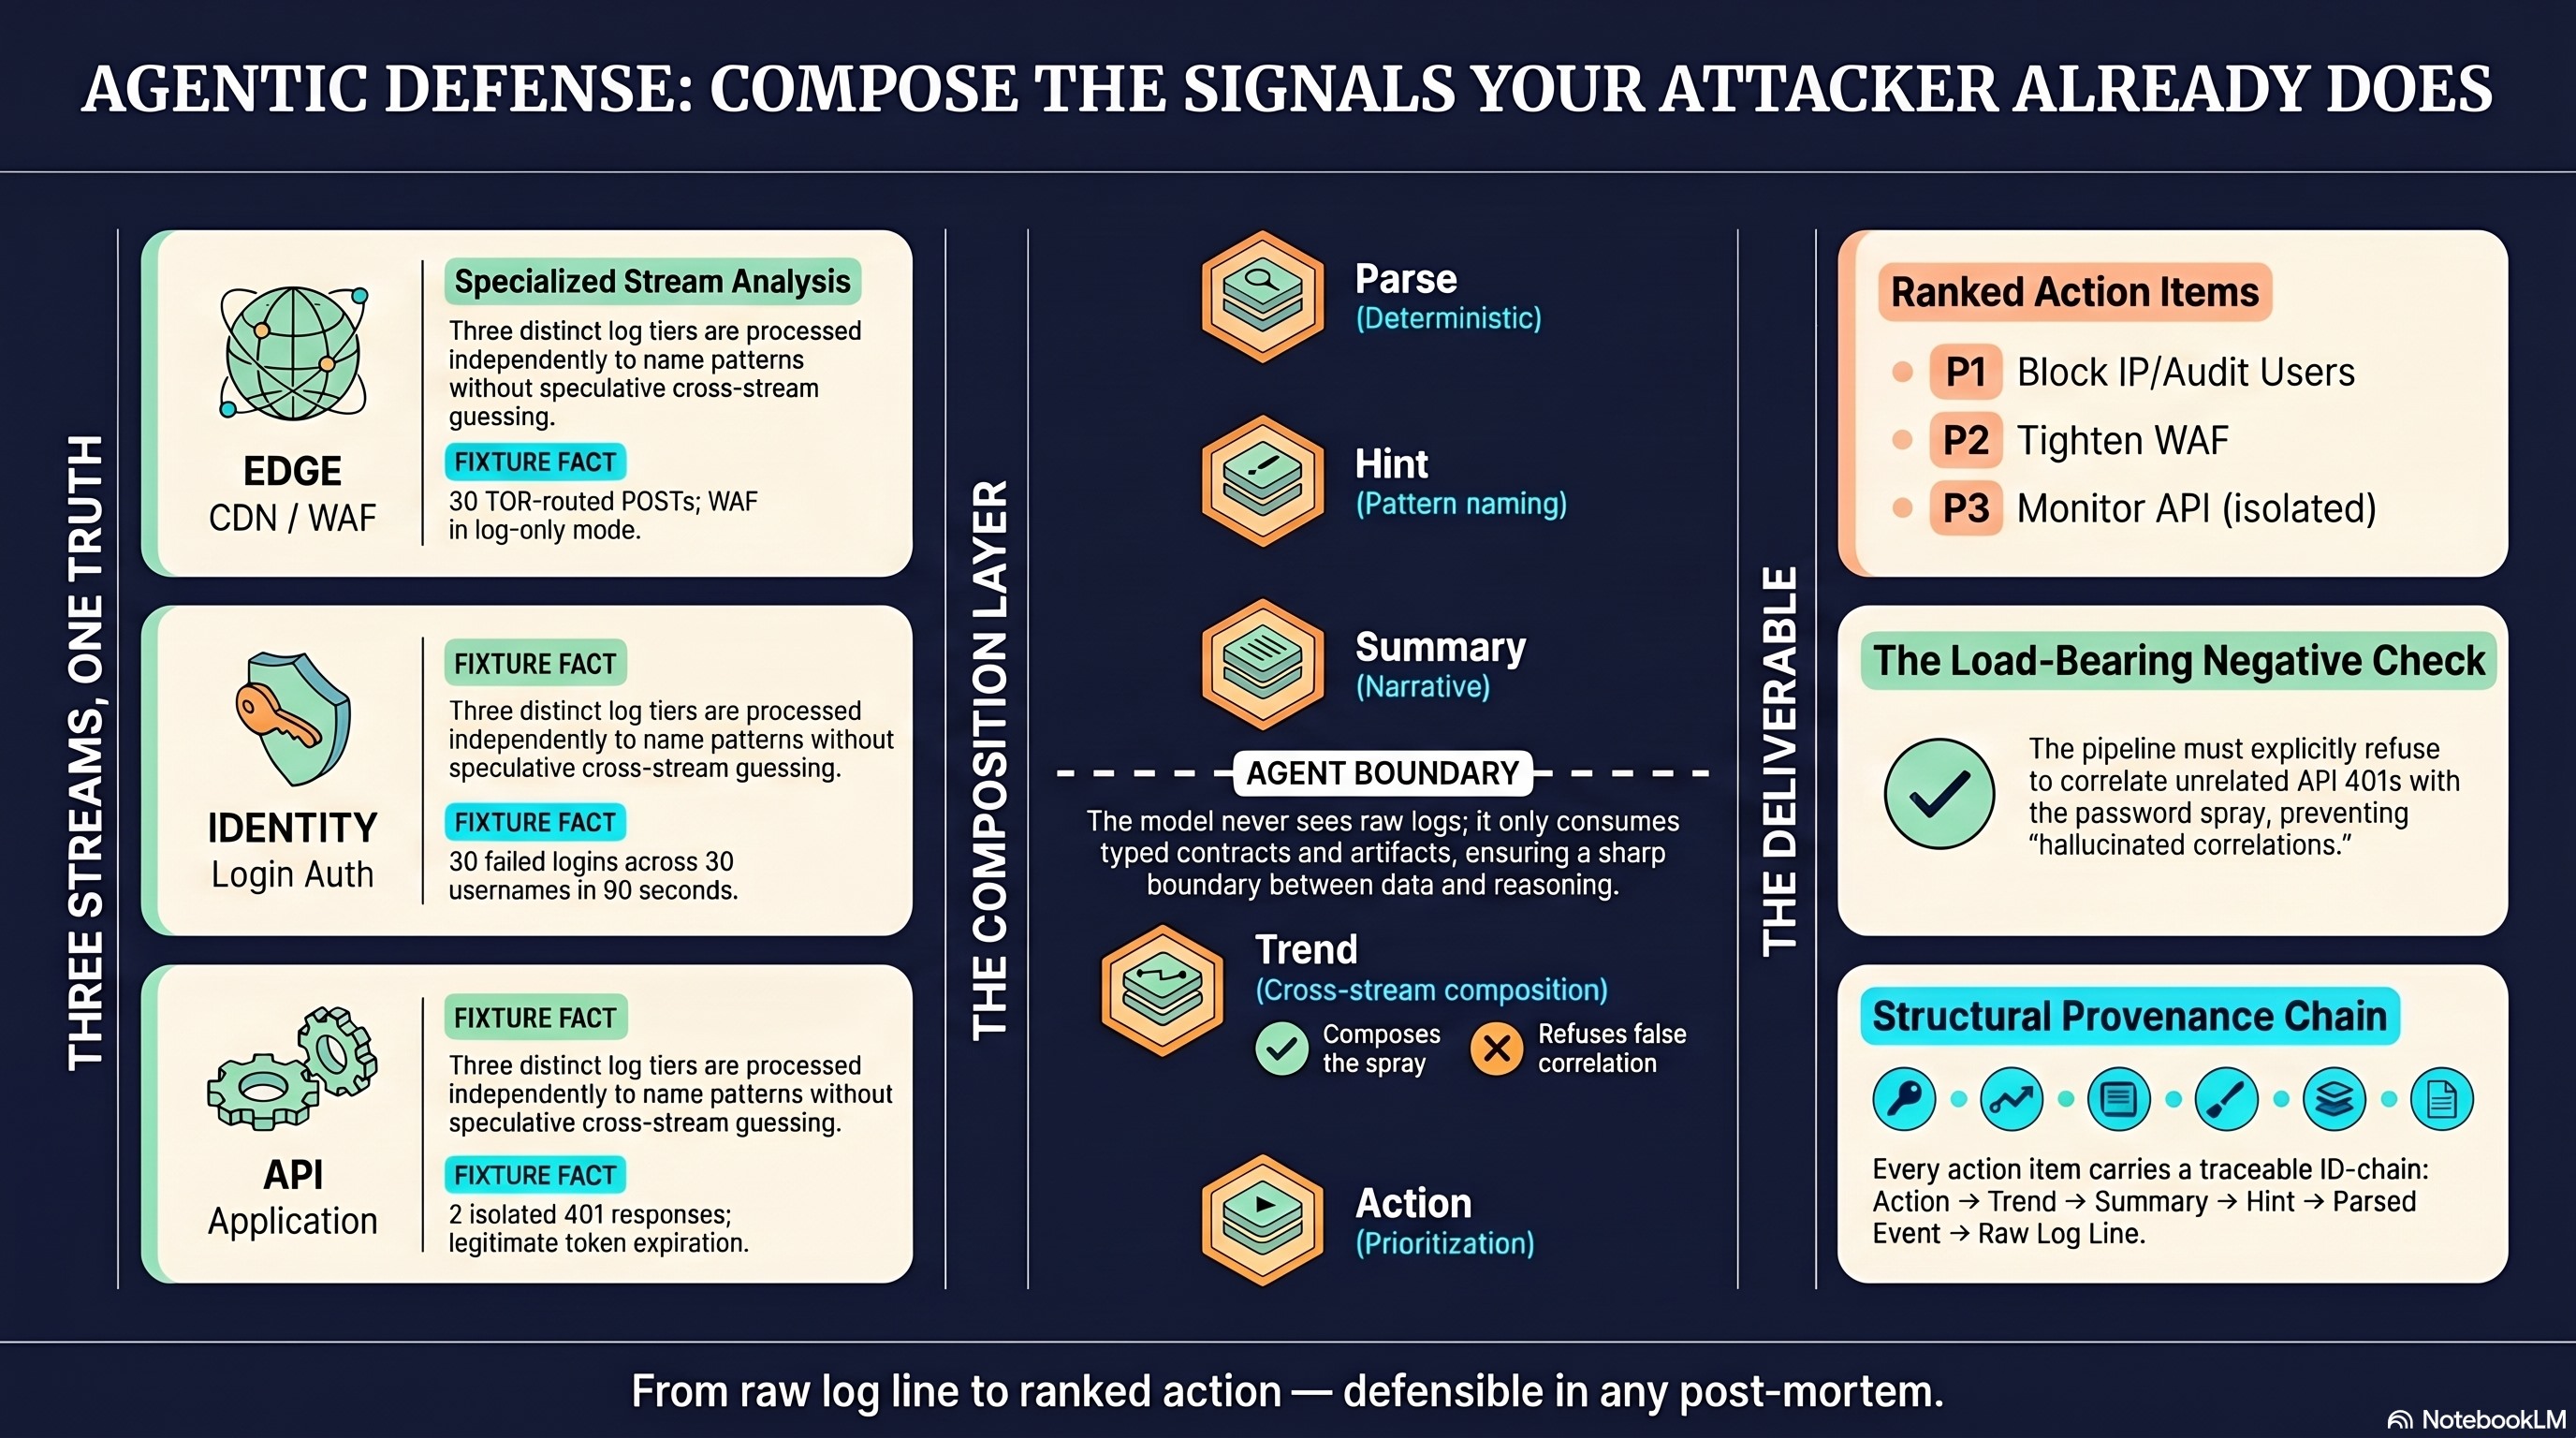
Use the current demo to inspect the connection between a hint and its underlying events. The fixture checks make a model's misses visible within this example; they do not establish detection performance on real incidents.
The source is available to inspect and extend. The handoff guide describes how to connect the staged analysis surfaces, add fixtures, and adapt the parsers. It gives an engineer a concrete starting point for testing the workflow against their own requirements.
Phase 1 uses manual copy and paste through a chat AI. Phase 2 automates the same prompts with your Anthropic API key; provider usage charges apply. The key lives in browser memory only — never written to disk, never exported.