I Upgraded Everything Around the Bottleneck. It Did Not Move.
A local-AI multitasking ceiling of exactly 8 survived a complete machine rebuild,
because it was never hardware. Finding one line of code, proving it guilty by dose-response across seven
models everyone knows, and moving it: the 9th parallel request gets 6.7× faster on the same GPU.
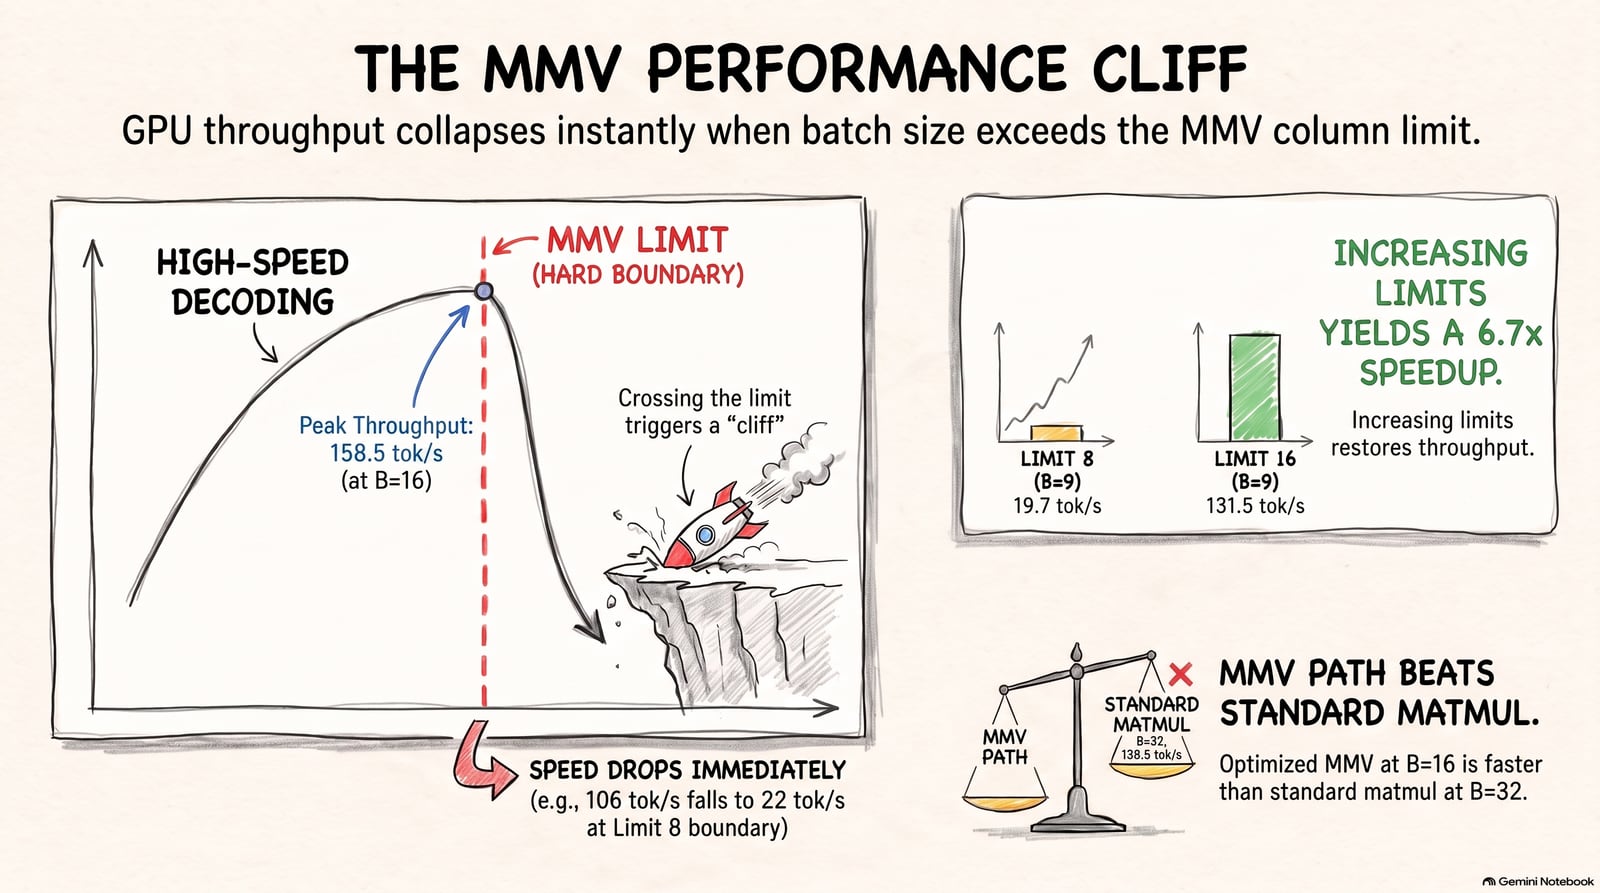
The cliff, as a notebook sketch. Illustration; the measured curves are further down.
In May I found a capacity cliff and explained it. In August I accidentally proved my explanation wrong
without touching the thing I was measuring. Then I found the real explanation, sitting in my own repository,
one directory away from the wrong one, the whole time.
The cliff, and the story I told about it
May 2026. Two Intel Arc Pro B70s in an aging AMD box: Ryzen 9 5900X, 32 GB of DDR4, Windows 10.
I was measuring how many concurrent LLM sessions the pair could serve before quality collapsed.
Throughput climbed with every session I added, peaked at eight concurrent sessions, then fell off a
cliff. Not a taper. By ten sessions, aggregate throughput had collapsed to a third and latency had blown
through every service target I had.
I went looking for a reason and found one immediately. Windows commit charge, the system's virtual
memory commitment, was at 92 percent right at the cliff. The box had 32 GB of RAM and models are
hungry. Plausible mechanism, measured correlation, tidy conclusion. I wrote it down: the host RAM is the
constraint. Eight is what 32 GB buys you.
I believed that for three months.
The accidental experiment
In August the two cards moved into a rebuilt machine. Intel Core Ultra 9 285K. 128 GB of DDR5.
Windows 11. A GPU driver a full year newer. Different motherboard, different PSU, different case. The only
things that survived the migration were the two GPUs and the models on disk.
If you wanted to design an experiment to test “the host RAM is the constraint,” you could
not do much better than this. Change everything around the suspect. Keep the suspect. See if the symptom
moves.
I re-ran the concurrency ladder with a different serving harness and a different model, a 30B
mixture-of-experts split across both cards. One slot: 40 tokens per second. Two: 72. Four: 113. Six: 145.
Eight: 183.
Ten: 80. Latency p95 went from six seconds to twenty-two.
The identical knee. The identical cliff. At the identical count. And this time the machine had
78 GB of commit headroom free at the moment of collapse. The host was not merely comfortable. It was
barely awake.
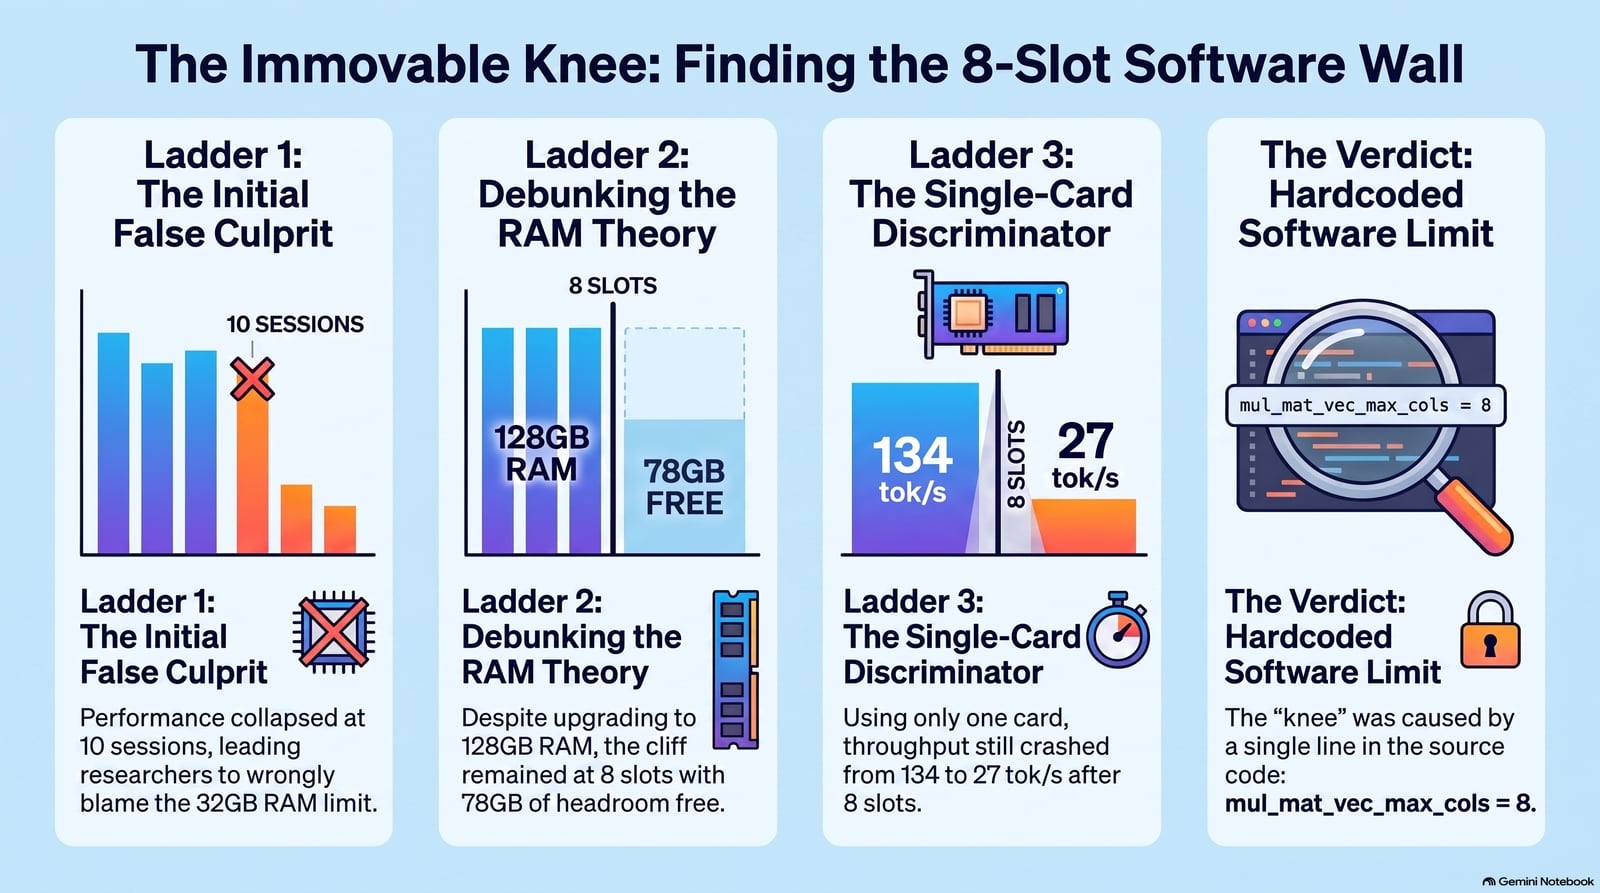
Three ladders, two machines, three model classes, one knee. Illustration of the discovery arc.
The explanation was already on my disk
I went hunting for the mechanism and found it in the cost model of my own public benchmarking repo,
written in May, during the same campaign that produced the wrong attribution:
N*_bw = SLO_TBT x B_vram / (k x L)     (bandwidth knee)
N*    = min( N*_bw , capacity_limit )
In words: aggregate decode throughput on a GPU is a memory-bandwidth roofline. Adding sessions does not
add aggregate tokens per second; it divides the same bandwidth into thinner slices. Now look at the terms.
A latency target. VRAM bandwidth. Model bytes per token. The host appears nowhere in that equation.
The formula I derived in May predicts the host-invariance I paid a full rebuild to discover in August.
I had derived the answer, published it, and then filed the question under a different explanation one
directory over. The commit-charge reading was real. It redlined at the same moment. It was the capacity
branch of my own min() expression looking like the binding term while the other branch did the binding.
The twenty-minute experiment
Two things still did not fit. The formula predicts a plateau past the knee, and I measured a collapse.
And a mixture-of-experts model reads far fewer bytes per token than a dense model, so its bandwidth knee
should have sat somewhere else entirely. Which whispered that the binding term at eight was not bandwidth
at all: something in the serving stack.
There was a twenty-minute experiment that discriminates. Run the same ladder on a small dense model, on
one card, nothing else resident. If the knee is the bandwidth roofline, it moves. If it is still exactly
eight, the limit lives in software.
Measured. Left: the 30B mixture-of-experts across both GPUs on the rebuilt box. Right: a dense
14B on a single GPU. Different bytes per token, different card count, different machine generation than
May. The knee does not care.
Dense 14B, single card: one slot, 27 tokens per second. Eight slots, 134. Ten slots, 27, with p95
latency going from nine seconds to seventy. Exactly eight. Third configuration, most violent cliff of the
three.
The wall has a name and a line number
That is not physics behaving like a constant. That is a constant.
ggml/src/ggml-vulkan/ggml-vulkan.cpp, the Vulkan backend of llama.cpp.
Decode batches of eight or fewer sequences take the fast matrix-vector kernel path. Nine or more fall
through to the general matrix-multiply path, which at decode shapes is catastrophic until the batch grows
much larger. That explains the count, on every host, at any card count, for any model, because a
compile-time constant is blind to all of them. It explains the cliff instead of a plateau, because a
kernel-path switch is discontinuous. It even explains the small recovery from ten to twelve slots that I
had no story for: the slow path scaling up, which is exactly what a path switch looks like and exactly
what resource exhaustion does not.
The number moved
A constant is an accusation until you move it. I patched it into a runtime switch: one file, two dozen
lines, default behavior byte-identical to stock. Then I ran the same benchmark three times on the same
binary with the limit set to 4, 8, and 16.
The cliff landed at 4, 8, and 16.
Measured dose-response, Mistral-Small-24B on one Arc Pro B70. Line widths are stepped because
the three runs produce identical numbers wherever the curves share a path; each collapses at exactly the
first batch past its own limit, and all three converge on the same slow-path floor beyond it.
Set the limit to four and the machine breaks at the fifth session. Leave it at eight and it breaks at
the ninth. Raise it to sixteen and eight sessions’ worth of ceiling stops existing: the ninth session
goes from 20 tokens per second aggregate to 131. That is a dose-response curve, and dose-response is what
causality looks like when it signs its work.
Then I asked whether it was a quirk of one model. Seven models people actually recognize, same Windows
11 machine, same Intel Arc Pro B70, stock limit versus 16:
model
class
9th thread, stock
9th thread, patched
gain
Phi-4 14B (Microsoft)
dense
28.7
195.1
×6.8
Gemma-3-27B (Google)
dense
16.1
110.3
×6.8
Qwen2.5-32B (Alibaba)
dense
12.8
88.1
×6.9
Mistral-Small-24B (Mistral)
dense
19.7
130.6
×6.6
Llama-3.3-70B, 2 GPUs (Meta)
dense
7.3
25.4
×3.5
gpt-oss-20b (OpenAI)
MoE
34.8
63.2
×1.8
Qwen3-30B-A3B (Alibaba)
MoE
65.8
74.3
×1.1
Aggregate decode tokens per second at batch 9, warm runs, llama-batched-bench thread
protocol. Full ladders for every model are in the repo.
The four single-GPU dense models gain 6.6 to 6.9 times at the ninth thread. The dense 70B model
split across two GPUs gains 3.5 times; the two sparse models gain 1.8 and 1.1 times. The benefit depends
on the model and serving configuration. My favorite detail is Gemma: on the stock build,
Gemma-3-27B at thirty-two sessions still moves fewer total tokens than it did at eight.
What the cliff feels like
Throughput charts undersell it. I run parallel coding agents against this box, so my unit of value is:
how many assistants can this machine keep in flow at once? Gamers measure their experience in frame pacing
and one-percent lows, so I measured mine the same way. Two hundred requests, ten at a time, per-request
latency logged like a frame-time trace.
Measured. Each bar is one request. Stock at ten concurrent is not stuttery; it is uniformly
broken, every stream crawling at 1.3 tokens per second, below human reading speed. Same load on the
patched build: median 38 seconds and 5.4 tokens per second per stream.
204 s → 38 s
median request latency at ten
concurrent, stock → patched. A ×5.4 improvement with identical hardware and watts.
1.3 → 5.4
tokens per second each stream
still delivers at ten concurrent. Below reading speed, versus comfortably above it.
8 → 16
the dispatch ceiling, moved. Twice
the parallel capacity from the same silicon, at zero hardware cost.
Did the math survive?
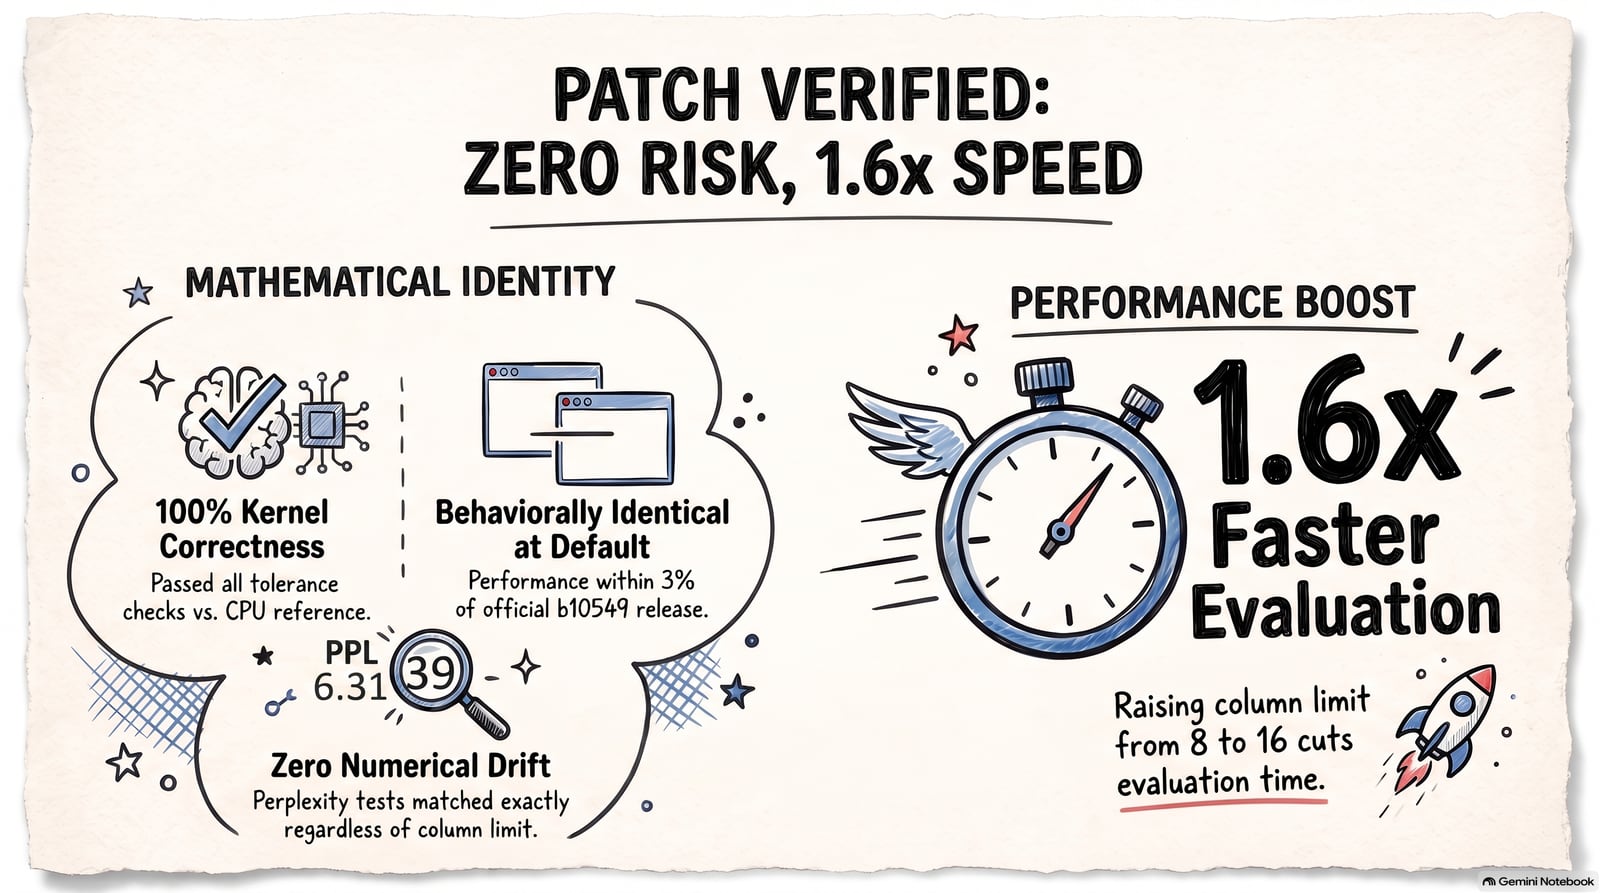
Three checks, because a speedup that changes answers is just a bug with good marketing. The backend's
kernel tests pass against the CPU reference at the raised limit, exercising batch widths 9 through 16 that
stock builds can never reach. The patched binary at its default is stock within noise.
The third check took a correction that made it stronger. My first perplexity A/B matched to every digit,
for the wrong reason: the tool's default micro-batch is wider than the knob's whole window, so the new code
path was never taken and the test could not fail. The original reporter of the upstream issue caught it
while reviewing the patch. Re-run with the micro-batch forced inside the window, the two kernel paths
differ by three hundredths of a percent, far inside the estimate's error bar, and the same-kernel control
matches to every digit. Different accumulation order, same quality. A null test retracted and replaced is
worth more than a green checkmark that cannot go red.
The results, as the notebook drew them. Illustration; exact numbers above and in the repo.
The lesson
My May conclusion was a correlation wearing a causation costume. Two gauges redlined at the same moment
and I charged the one I understood.
Capacity limits deserve attribution experiments, not just correlated readings. Admission control should
pin at the measured knee, and the trigger for re-measuring is a software update, not a hardware upgrade. I
had that exactly backwards: I re-benchmarked when the metal changed, when the thing that actually owned my
ceiling was a header constant that has survived every machine I ran it on.
And the lesson I did not expect: past rigor is an asset you have to actually consult. The right
equation sat in my own repo for three months while I repeated a wrong explanation from memory. Instruments
do not just need to be built. They need to be read.
The serving stack in this story runs my local inference full time, and until this week it was capped
below the knee. Next week the same machine serves twice as many assistants. The hardware will not have
changed at all.
The whole hunt in six and a half minutes: the fake hardware wall, the discriminating experiment, the line of code, and the number moving.
Receipts. Everything is public in the
vulkancliff repo: the one-file patch, every raw
benchmark output, the spill-guarded harnesses that produced them, the charts and their generator, and the video above (also
mirrored on GitHub).
The same cliff is reported on AMD hardware in
llama.cpp issue #25356; the CUDA backend
merged the equivalent knob in August. The patch was submitted upstream as
PR #27652, with this repo as its evidence
base.
October 7, 2026 correction: the six-to-seven-fold gain applies to the four
single-GPU dense rows above. The dual-GPU dense result is 3.5×. PR #27652 remains open
and unmerged as of this review.