Local AI · measured field report
What Consumer Hardware Actually Does
Twenty-nine indexed local-model labs plus the August rebuild and Qwen 3.8 campaigns, across an RTX 4070 Ti, an RTX 5070, and a pair of Intel Arc Pro B70s. Every number below is measured, dated, and attributed to the lab that produced it.
October 7 revision: corrected the Windtunnel scoring comparisons and clarified the Vulkan throughput comparison. Measurements retain their original dates.
Sixty-four gigabytes of VRAM for near or less than the price of one flagship card is a trade almost nobody writes up. Here is what it actually returns, where it stops, and why the binding constraint depends on which phase of the workload you are in.
Scope note · 7 October 2026. The measurements and diagrams below describe the May–August 2026 configurations and operating systems under test. Their original measurement dates and results are retained. For current released activity and recorded runtimes, see the HEARTH pulse; that aggregate is not a new benchmark of these configurations.
Corrections · 7 October 2026. The load table now separates first loads from steady loads and includes all fourteen retained trials. Captions distinguish commit charge from throughput efficiency, remove an unsupported per-card weight total and KV transfer-rate calculation, and identify the two requests behind the 306× cache ratio. These corrections describe the retained measurements; no new benchmark runs were made.
The article in eight findings
Contents
The lab, in charts
What used to be one crowded speed chart is now a walk through the lab with its cast: what the machines can hold, what the answers are worth, and where the verdict flips. Every panel is one idea, one chart, and the table behind it.
How the rig got here
None of this was bought as a lab. It accreted, one constraint at a time, and the sequence explains most of the numbers below — including the one that keeps breaking.
| Step | The machine | What it unlocked |
|---|---|---|
| 1 | A Ryzen daily driver on Windows 10 with an RTX 4070 Ti, 32 GB DDR4 | First local models, on Ollama. The planner-and-critic experiments in section 1 ran here. |
| 2 | Same box, two Intel Arc Pro B70s go in | Bought at MSRP, which is the entire reason this configuration exists. 64 GB of VRAM on a machine with 32 GB of system RAM — the inversion behind finding 1. |
| 3 | An open-box workstation, 128 GB DDR5 + RTX 5070, becomes the daily driver | Frees the first box from having to be anyone's desktop. Also the rig for every 12 GB NVIDIA measurement in section 1. |
| 4 | The B70 box converts to native Linux | Only possible once it wasn't the daily driver. Unlocked Intel's Battlematrix multi-GPU stack — and everything in section 3. |
| 5 | Completed 20 August: both B70s move into a rebuilt 128 GB DDR5 workstation | ASUS Pro WS Z890-ACE SE, Core Ultra 9 285K, Windows 11 and Vulkan. The RTX 5070 leaves; the Intel iGPU and ASPEED adapter drive the displays, so both B70s are headless. |
Step 2 created the original experiment: two large GPUs bolted onto a machine whose system memory was specified for one. Step 5 did more than fix that mismatch. It held the cards constant while replacing the board, CPU, RAM, operating system, driver and display path. The result turned the planned upgrade into a controlled challenge to the article's own conclusions.
Three eras, the same cards. The B70s ran first on Windows 10 + Vulkan, then on
native Ubuntu + SYCL / Level Zero, then in the rebuilt workstation on Windows 11 +
Vulkan. Harnesses still define the comparison boundary: old and new numbers are comparable only where the
campaign deliberately repeated the workload.
Eight findings, corrected by the rebuild
1. The binding constraint changes by phase
The original Windows box had 64 GB of VRAM and 32 GB of DDR4, and host memory broke repeatedly. A stack sweep found swap saturated with one 30B resident. A judging run OOM-killed until context came down from 32k to 8k. Three large models enabled together produced 81 crash-loop restarts and about 18 GiB of driver allocations recoverable only by rebooting. That dated conclusion remains true for that machine.
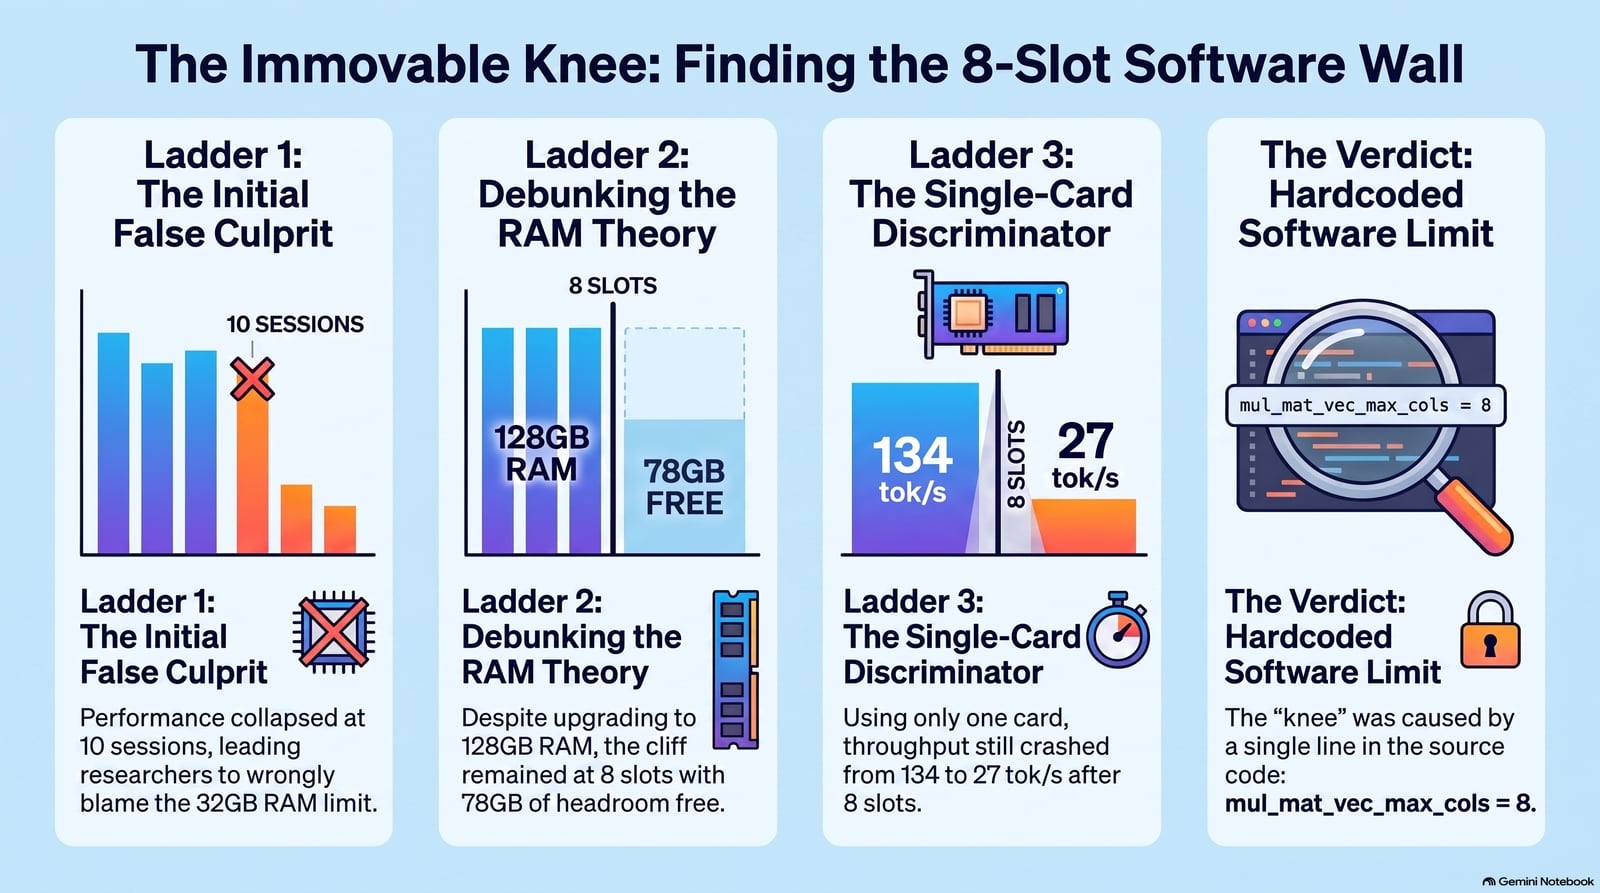
The 128 GB rebuild made the broader claim false. The eight-request knee remained with 78 GB of commit headroom; that wall was a Vulkan dispatch choice. Context-depth decay remained because KV lives in VRAM. And RAM still governed placement at load: a 70B loaded at 92% commit ran prompt processing at 11.8 instead of at least 150 tok/s, and freeing the co-tenant did not repair the process. Commit and placement bind at load, kernel dispatch binds under concurrency, and KV plus attention bind at depth.
2. MoE is the architecture that fits consumer hardware
At equal size — roughly 32B total parameters, Q4, one card — a 3B-active mixture-of-experts decoded 5.0× faster than a dense 32B (112 vs 22 tok/s) and prefilled 2.9× faster. That decode figure was re-measured in August 2026 with both models warm, interleaved and placement asserted; the dense side reproduced almost exactly, so the correction falls entirely on the sparse side. Decode streams only the active parameters, so sparsity buys back exactly the memory bandwidth consumer cards don't have. Every practical result in this whole corpus rests on that.
3. Backend and kernel choice swing results more than the GPU does
Same model, same card, same prompt: CUDA processed the prompt at 2276 tok/s and Vulkan at 68.5. A 33× spread on identical silicon. The old Vulkan stack also made flash attention about 4× slower and q8 KV 2–4× slower. The rebuilt campaign narrowed both rules: flash-attention-off wins by 25–87% below a 16k–24k crossover, then hangs; q8 KV costs only 5–6% at 32k and 64k on the newer build, though its 128k hang remains. Configuration findings belong to a measured stack, not to the logo on the card.
The most extreme case is a single flag. Running a 70B across both B70s, turning memory-mapping off took prompt processing from 21.5 to 151.4 tok/s — a 7× win, and the difference between "unusable" and "usable". Nothing about the hardware changed. If you are benchmarking a local stack and the number looks absurd, suspect the configuration before the card.
4. Context depth is the real cliff, not model size
A 30B MoE that fits comfortably on one B70 decodes at 86.9 tok/s empty and 5.3 tok/s at 64k context. On the Windows/Vulkan side the same shape showed 132.8 tok/s empty falling to 11.5 at 64k — roughly linear to 32k, then a superlinear cliff. Meanwhile prompt ingest dominates the wall clock: a 57,000-token request spent 207 of its 213 seconds just reading the prompt.
Which means the thing worth engineering is not placement. It's caching. An identical 8k prompt sent twice went from 11.8 s to 0.17 s — 68× — on cache hit. And restoring a saved KV cache beat re-computing it by 29× on real bytes, with the advantage growing with context: 22× at 1k, 75× at 14k.
5. Local output held up against frontier cloud
On a scored documentation and decision-record task, the local 120B model scored 93.8 against Gemini 3.1 Pro's 90.6 and 3.5 Flash's 89.2. The cloud's measurable advantage was latency — about 4–5× faster — and that was the entire advantage. One task family, fifteen cells — not a claim that local wins everywhere. The narrower claim: "local is the cheap option you settle for" did not survive contact with a rubric.
6. And you can train on it, not just serve
The one most likely to be assumed impossible. A LoRA fine-tune of a 7B coder model, running on one Arc Pro B70 on Windows via PyTorch's XPU backend, took held-out loss from 2.96 to 1.13 in 108 seconds of training — then merged, quantized, and served on the same card in about six seconds, generating correct code. Full detail in section 6. Local inference is well-trodden ground by now. Local weight-changing, on a non-NVIDIA consumer card, is not.
7. A benchmark's operating point can decide the verdict
The newest correction, and the one aimed at this article's own method. A dense 27B failed a promotion gate at 0.69× the incumbent's throughput and beat the same incumbent by 5.49× on the same box the same day — the only difference was prompt length. The gate sampled 512-token prompts, which is an unstated claim about the workload. Where decode dominates, a sparse model with 3B active wins; where prefill dominates, that reverses. Detail in section 5.
8. The machine's state when you measure decides it too
Finding 7 says the workload you sample is an unstated claim. This one is narrower and harder to see: the same box, the same model, the same flags and the same prompt, measured twice, give two different answers depending on what the machine was doing beforehand. Left idle for more than about a minute, the production rung moves to a lower stable rate and stays there — 106.5 tok/s after 0, 30 or 60 seconds of idle, 39.5 after 120 seconds, and a flat ~27.5 under continued load. It is not warm-up noise. Repeats agree to a fraction of a percent on both sides of the transition, and the 120-second result reproduced on a second server to within 0.5%.
The fix is far smaller than the problem. A one-token request every 20 seconds holds the rate at 104.83 tok/s, indistinguishable from a freshly loaded server. It costs about 45 ms per tick, and it runs as a scheduled job on a different machine, because a keep-alive that runs on the box it is keeping alive dies with that box.
Two details are worth carrying away. The first request after an idle gap pays a stall of roughly 11.5 seconds regardless of how much work it asks for — 10 735 ms to prefill eleven tokens — and that stall is largely invisible to llama.cpp's own timings: on one such request the server reported 47.1 ms of prompt evaluation while its own slot log spanned 11.54 seconds. Anything that trusts the engine's reported numbers will miss it. And across one night the same rung held four distinct stable rates, moving between them in both directions with nothing changed, which bounds how much weight any single throughput figure from any machine can carry.
For anyone running a model locally the consequence is blunt: if you ask it a question every few minutes, you are never in the regime the benchmarks describe. The published number is the machine at its best, and the machine is only at its best when it has just been busy.
Source: idle-duration ladder and keep-alive arms, dual Arc Pro B70, August 2026. Two runs at the 120-second point; mitigation verified over a six-minute hold.
1 · NVIDIA consumer — RTX 5070 and 4070 Ti, 12 GB each
Rig: HP OMEN 45L · Intel Core Ultra 9 285K (24 threads) · 128 GB DDR5
· RTX 5070 12 GB GDDR7 · Intel iGPU · Intel AI Boost NPU · Windows.
The 5070 labs: 2 July 2026. A separate round on an RTX 4070 Ti 12 GB GDDR6X
ran from June.
Backend lab — CUDA vs Vulkan vs the integrated GPU
The same model and prompt driven through four isolated servers on separate ports, to find out what the backend choice alone is worth.
| Backend | Device path | Load | Prompt eval | Output |
|---|---|---|---|---|
| CUDA | RTX 5070 | 3.11 s | 2276.17 tok/s | 59.88 tok/s |
| Vulkan | RTX 5070 | 11.11 s | 68.51 tok/s | 42.26 tok/s |
| Vulkan, mixed | RTX + Intel visible | 9.13 s | 1921.88 tok/s | 45.32 tok/s |
| Vulkan | Intel integrated GPU | 12.35 s | 47.90 tok/s | 3.70 tok/s |
- The integrated GPU really can run models — it loaded 49.6 GiB of the Mixtral into Intel shared memory and ran at 0.83 tok/s. A capability proof, not a lane: it left under 5 GB of free system RAM.
- "Both GPUs visible" is not a useful split. Mixed Vulkan enumerated both devices, then placed the small model entirely on the RTX and the large one on RTX plus CPU-mapped RAM. The Intel part was never materially used.
- Running a second model concurrently is survivable but expensive: the 14B fell from ~61.9 to ~21.5 tok/s, and a 30B coder model fell to 4.12 tok/s.
Source: Ollama backend lab — results summary, raw CSV, per-profile JSON and runner logs. 2 July 2026.
The 52 GB sparse model, off system RAM
| Context | Prompt tokens | Prompt eval | Output | Resident |
|---|---|---|---|---|
| 8,192 | 6,875 | 224.79 tok/s | 4.12 tok/s | ~53–56 GB |
| 16,384 | 14,425 | 243.91 tok/s | 3.77 tok/s | 56 GB |
| 32,768 | 28,770 | 205.41 tok/s | 2.27 tok/s | 60 GB |
Cold load 39.6 s, warm load 0.03 s — residency is the whole cost. The machine stayed responsive throughout and never obviously paged.
Source: local MoE findings note. 2 July 2026.
The capability matrix and the baseline protocol
Two more documents from the same day turn those numbers into decisions rather than trivia. A
capability matrix assigns each model class an operational role — resident controller,
interactive specialist, batch specialist, fallback worker, overnight critic — and tags every cell
measured, published, or inferred, so you can see which claims came off this
rig and which came off a model card. Its operating conclusion: a 12 GB GPU strongly favours a control-plane and
specialist split, and the constraint is residency, not active parameters. A 30B MoE behaves like a
small model per token, but its total weights still drive placement.
The other is a dated baseline snapshot plus a written rerun protocol, built deliberately so a future Arc Pro B70 rerun would be comparable. Warm load for both test models collapses to about 0.10 s. Worth noting for anyone building on Ollama: same-service "concurrency" there behaved as queueing against one daemon, not true batched serving.
Sources: hardware capability matrix; RTX 5070 baseline snapshot and baseline protocol. 2 July 2026.
What the raw logs said that the summaries didn't
Going back through the raw per-call CSVs — which log GPU utilization, memory and power draw before and after every request — turned up two things no summary of mine had stated.
| Scenario | Model | Load | Prompt tok/s | Output tok/s | GPU power |
|---|---|---|---|---|---|
| baseline, cold | qwen2.5:14b | 4.52 s | 1015.63 | 61.82 | 8 → 203.4 W |
| warm, back-to-back | qwen2.5:14b | 0.13 s | 7154.04 | 62.00 | 30 → 203.8 W |
| baseline, cold | qwen3-coder:30b | 13.10 s | 294.37 | 57.40 | 22 → 66.7 W |
| long prompt @ 8k | qwen3-coder:30b | 10.27 s | 2154.12 | 50.79 | 21 → 82.7 W |
- The 30B draws a third of the power the 14B does — at the same token rate. 66.7 W against 203.4 W, for 57.4 vs 61.8 tok/s. A 12 GB card running a 30B mixture-of-experts is memory-bandwidth-bound and barely touching its compute; the dense 14B saturates it. That's a performance-per-watt argument for sparse models, and it matters if the box runs all day.
- Warm prompt throughput is 7× the cold headline number — 7154 vs 1015 tok/s. Quote the cold figure and the steady state is badly understated.
Source: raw capability-bench and cross-service CSVs, RTX 5070. 2 July 2026.
The model matrix — on the 4070 Ti
Worth separating, because it's a different question and a different card. Where the 5070 work is two models deep and many scenarios wide, this one is model-wide: a planner-and-critic loop run across different model pairings to find where it breaks. It broke in three distinct places, each run isolating one.
- An 8B planner with a 3B critic produced a false approval. The critic signed off on a plan in which five of six file paths did not exist. Cause: the planner had been given only a README excerpt and a top-level directory listing, so it invented a layout — and the critic had no repository context at all, so it couldn't catch the invention. Fix: give both roles the actual tracked-file tree.
- After the fix, paths were correct and the loop stalled anyway — on critic noise. The 3B critic engaged but degraded to bare noun-phrases by round three and missed concrete bugs. The grounding fix was model-agnostic; the critic's capacity was not.
- A 20B critic was transformative and still didn't converge. Seven specific, grounded issues in round one — real compile errors, undefined symbols. Round two nearly converged; round three regressed, with the planner emitting a corrupted path. Still an open question: was that the 8B planner's weakness, or VRAM contention from co-running a 13.6 GB critic alongside it on a 12 GB card?
That question is unresolved — and it is the single best argument for the dual-B70 box that follows: 12 GB forces a choice between a good planner and a good critic, and the choice is what breaks.
Source: local-inference research series and rehearsal run log, RTX 4070 Ti on Ollama/CUDA, from 5 June 2026.
2 · Intel Arc Pro B70 — the Windows / Vulkan era
Rig: 2× Intel Arc Pro B70 (Battlemage Xe2, 32 GB GDDR6 each) ·
AMD Ryzen 9 5900X · 32 GB DDR4 · Windows 10 Pro · PCIe 4.0 ×8/×8 (the cards are
PCIe 5.0 capable; the host limits them). These three repos are public.
b70tools — is Task Manager telling you the truth?
It wasn't. That's why the tool exists. It reconciles four independent telemetry sources — kernel-mode adapter counters, per-process heap budgets, the Vulkan memory-budget extension, and Intel's own power/thermal API — and flags where they disagree in real time.
| Workload | Config | Generation | Prompt | VRAM/card |
|---|---|---|---|---|
| Mistral-Small-3.2-24B Q4_K_M | single card | 27.3 tok/s | ~400–443 tok/s | 14 GB |
| Qwen3-30B-A3B MoE Q4_K_M | dual split | 81.7 tok/s | 30.1 tok/s | 8.5 GB |
| Qwen2.5-32B-Instruct Q4_K_M | dual split | 20.7 tok/s | 242.2 tok/s | 9.3 GB |
Look at the middle two rows: the 30B MoE generates four times faster than the 32B dense, while the dense model prompts eight times faster. Different bottlenecks, same box.
The other finding was about the cards themselves. They're physically identical and they are not identical in software: the top-slot card runs 10–15 °C hotter under identical load and its telemetry reports physically impossible values — 5.117 V and 8.55 GHz at idle. That's a driver bug, not a hardware one. It took several experiments to conclude the cards deliver identical inference throughput, which is the whole argument for building the observation tool before trusting the dashboard.
At the time, that conclusion was not airtight. Four days earlier, the overnight bench below measured
the bottom card generating 18% faster than the top one on an identical 14B — 50.09 vs 42.37
tok/s. Both results remain here because that contradiction was real in May. The controlled August rebuild A/B later
put the cards within ±1.6% and traced the old gap to ECC asymmetry; see the resolution.
Source: github.com/djcdevelopment/b70tools — Windows-native telemetry workbench, May 2026. Observation cost: 16.6 MiB RSS, under 130 ms init.
The overnight campaign — 14B, 32B, and a 70B across both cards
A phased ladder run overnight: each card alone on a 14B, then a 32B, then Llama-3.3-70B tensor-split across both, plus a context curve and a KV-precision comparison. About a hundred files of raw output. This is the run the rest of the Windows era was built on.
| Model | Placement | Prompt tok/s | Generate tok/s |
|---|---|---|---|
| Qwen2.5-14B | single card (top slot) | 1261.06 | 42.37 |
| Qwen2.5-14B | single card (bottom slot) | 1335.68 | 50.09 |
| Qwen2.5-32B | single card | 591.88 | 23.69 |
| Llama-3.3-70B | dual, tensor-split, mmap on | 21.49 | — |
| Llama-3.3-70B | dual, tensor-split, mmap off | 151.41 | 11.28 |
- The mmap flag is the whole story on the 70B. 21.5 to 151.4 tok/s of prompt processing — 7× — from turning memory-mapping off. With it on, a 70B on this box is a curiosity. With it off, it's a tool. Eleven tokens a second of generation is slow, but it is a 70-billion-parameter model running on two cards that together cost less than one flagship.
- Prompt throughput peaks mid-batch, not at maximum. On the 14B: 903 tok/s at a 128-token prompt, 1254 at 512, then back down to 1160 at 2048. Generation stayed flat at ~45 regardless.
- The quantized-KV run produced nothing at all. It ran for 221 seconds and emitted only a loader banner; the deep-context variants are error dumps. Logged at the time as a failed run. A month later the flash-attention finding explained it — the trap was already in the data, unread.
- Where the fp16 curve did complete on the 70B: 186 tok/s of prompt processing at both 1k and 4k, falling to 121 at 16k.
Source: overnight bench campaign, dual Arc Pro B70 on Windows Vulkan, 24 May 2026. Roughly 100 raw JSONL and log files, retained.
denning — treating the KV cache as an OS-managed resource
The deepest lab in the set, and the one to hand a skeptic. The premise: on a box with no GPU fabric, less system RAM than VRAM, and an operating system arbitrating video memory, correct model-state management is bandwidth-roofline admission control — and you have to coexist with an OS memory manager that will act against you. Named for Peter J. Denning's working-set model. Predictions were committed to git before the data that confirmed them.
- The demotion cliff. Once another app pushes the GPU past its memory budget, the OS involuntarily evicts a model that fits — decode collapses 5× with about 5 GB spilled across PCIe. The live budget drops from 31 GB to 15 GB under a co-tenant. Reproduced twice. You cannot pin against it: the residency-priority API is an intra-process hint only.
- Decode roofline for the 30B MoE: 132.8 tok/s empty, 74.3 at 8k, 58.2 at 16k, 38.0 at 32k, 11.5 at 64k.
- Restore beats re-prefill by 29× on real KV bytes (84 ms vs 2422 ms), and the gap widens with context — 75× at 14k, where re-prefill costs 24.7 s and restore costs 0.33 s.
- The admission knee: goodput under a latency target peaks at 8 concurrent sessions (229 tok/s, all targets met) and collapses to zero by 10. Over-admission is worse on every axis.
- Card-to-card transfer is 6.48 GB/s — about 0.47× host-to-VRAM speed, because it is host-bounced. There is no peer-to-peer on this platform. Hold that number; it comes back.
The May retraction. The two-card symmetric scaling result — a clean 1.96× by replication
— was marked provisional and under correction. Driving both cards symmetrically, including the display
card, reproducibly tripped a Windows display-driver timeout and reset: four resets across two sessions. The
concurrency run collected across two of those resets was retracted outright rather than published. In August, the
headless rebuild isolated the display path and resolved the retraction with clean 1.85× scaling; both stages of the
record are retained.
Source: github.com/djcdevelopment/denning — on-rig validation 19–21 June 2026, dual Arc Pro B70, Windows / Vulkan.
The single-card battery — PCIe width turns out not to matter
After a thermal pull left the box on one card, a six-part battery ran at full PCIe ×16: prefill, model load, session rotation, restore-versus-re-prefill, an engine probe, and a 70B deliberately overcommitted. Predictions were locked to a git tag before the data was collected.
- PCIe link width was irrelevant to everything measured. That's the useful negative result: if you're agonizing over slot bifurcation, or whether your board drops a card to ×8, this says stop. The binding constraints are compute (the decode cliff), host RAM and commit (the memory inversion), and your storage tier — not the link.
- The restore-versus-re-prefill advantage held between 133× and 475× in this run.
- The overcommitted 70B spilled 7.5 GiB into shared system RAM — the OS demoting a model that no longer fits, confirmed again.
Source: pre-registered single-card ×16 battery, one Arc Pro B70 on Windows, 21 June 2026.
battlemage — where it started
The earliest of the three: single- and dual-card Windows 10 benchmarking, including the dual-card 70B-class run on Vulkan that first proved 64 GB of shared inference was real on these cards. Superseded by the two repos above for anything load-bearing, and worth knowing it exists.
Historical repository reference: github.com/djcdevelopment/battlemage — from May 2026. As checked on 7 October, the public repository is empty and does not expose the retained measurements.
3 · Intel Arc Pro B70 — the Linux / SYCL era
Rig: the same box, migrated to native Ubuntu 26.04 on the modern
xe kernel driver with a current Level Zero stack · llama.cpp SYCL build · both B70s
· Ryzen 9 5900X · 32 GB DDR4.Does splitting a model across two cards help? (29 June 2026)
The first Linux-native benchmark asked two things: does multi-card work on Ubuntu the way it didn't on Windows, and is splitting actually better than using one card?
| Context depth | single — prompt | single — generate | layer — prompt | layer — generate |
|---|---|---|---|---|
| 0 (empty) | 1205.85 | 86.92 | 1146.01 | 84.30 |
| 8,192 | 612.12 | 29.12 | 607.23 | 28.64 |
| 16,384 | 405.44 | 17.65 | 405.73 | 17.48 |
| 32,768 | 241.36 | 9.91 | 240.64 | 9.86 |
| 65,536 | 132.31 | 5.28 | 130.71 | 4.89 |
| 131,072 | timed out — no throughput inside a 420-second budget | |||
Multi-card layer split works, and buys nothing for a single stream. Parity through 32k, slightly worse at 64k. The second card is capacity, not speed. The more aggressive split modes weren't even candidates: row-split segfaulted on both variants, and tensor-split timed out and then segfaulted.
Source: SYCL context-ladder lab, dual Arc Pro B70 on Ubuntu, 29 June 2026.
The same question through a real server
Benchmarks measure the model. This measured what a client experiences — a resident server at 128k context behind an OpenAI-compatible facade, timing readiness, time-to-first-token, streaming and cache reuse.
| Prompt tokens | Total request | Prompt tok/s | Generate tok/s | Time to first token |
|---|---|---|---|---|
| 7,208 | 9.8 s | 863.49 | 22.44 | 1.03 s |
| 14,342 | 23.4 s | 671.72 | 15.74 | 1.66 s |
| 28,651 | 66.0 s | 456.64 | 9.92 | 2.91 s |
| 57,228 | 213.3 s | 275.69 | 5.69 | 5.43 s |
Then the concurrency ladder, at about 14,300 prompt tokens: 1 client 22.9 s, 2 clients 45.3 s, 4 clients 91.0 s, 8 clients 181.5 s. Almost perfectly linear — which is the bad news. Time-to-first-token is nearly identical to full completion time at 1 through 4 clients, meaning streaming stops being useful the moment concurrent prompt ingest dominates. The conclusion there is architectural, not hardware: what needs work is request scheduling, prompt-cache strategy and admission control.
Source: service-path placement matrix, depth ladder and concurrency ladder, 29 June 2026.
What the two cards can actually say to each other (18 July 2026)
Remember the 6.48 GB/s host-bounced number from Windows. On Linux, with the modern driver and Level Zero stack, the peer-transfer benchmark was built from source and run — 50 iterations, 8 bytes to 256 MB.
| Mode | Operation | Bandwidth at 256 MB | Latency floor at 8 B |
|---|---|---|---|
| Unidirectional | Write | 14.29 GB/s | 6.17 µs |
| Unidirectional | Read | 13.06 GB/s | 7.75 µs |
| Bidirectional (aggregate) | Write | 16.61 GB/s | 5.07 µs |
| Bidirectional (aggregate) | Read | 20.92 GB/s | 6.67 µs |
| Dedicated copy engine | Write | 14.29 GB/s | — |
14.29 GB/s is the practical ceiling of PCIe 4.0 ×8. Going through the root complex costs nothing. That is the same traffic that was host-bounced at 6.48 GB/s on Windows — and it is the single cleanest measurement of what the Linux migration was worth on this hardware. Transfers are perfectly symmetric in both directions, and the dedicated copy engine matches the compute engine exactly, so bulk weight and cache movement can ride the blitter without stealing compute.
Source: peer-transfer microbenchmark, dual Arc Pro B70 on Ubuntu, 18 July 2026.
A 63 GB model, resident, on two consumer cards (18 July 2026)
The question was whether a 120-billion-parameter MoE — 63.4 GB in a single file — can be an always-warm service on hardware like this.
| Metric | Value |
|---|---|
| Cold load to health-OK | ~3.2 min |
| Warm prefill | 221.6 tok/s |
| Decode, single stream | 26.6–28.7 tok/s |
| Concurrent decode, 4 slots | ~31 tok/s aggregate |
| Host RAM, steady state | 12 GiB used / 18 GiB available |
| Service restarts across the soak | 0 |
It fits only because about four layers of experts ride host memory rather than VRAM — that flag is required, not tuning, since 63.4 GB of weights exceed roughly 60 GiB of usable VRAM. Sparse architecture plus a little CPU offload is the whole trick.
Then the attempt to break it
The brief was blunt: find out if it breaks before we build things with it. Six sweeps — concurrency ladder, context depth, decode-heavy, sustained soak, overload burst, and memory pressure. 453 requests, 453 successes, zero restarts.
- Goodput saturates at ~26 tok/s at four concurrent and holds flat to sixteen. Oversubscription costs queue latency, never throughput. The queue is stable and fair.
- 32 concurrent requests against 4 slots: all completed, zero errors. A textbook linear queue drain, 105 s max wall.
- Memory pressure barely registered. A hog process stepped up to 18 GiB — about 48 GB of demand against 30 GB physical — and decode lost 4% or less. Hot expert pages won the page-cache fight and compressed swap absorbed the rest. Caveat stated in the lab: the hog's pages compress near-perfectly, so that's a best case.
- Thermals are a non-issue: 78 °C peak GPU die at full sustained load, against a proven 92 °C envelope for image generation on the same box.
The one real trap: over-limit prompts truncate silently. A deliberate 17,500-token request against a
16,000-token slot ceiling did not error. It returned success, normal time-to-first-token, normal decode
— the server had quietly truncated the prompt to fit. Context loss with no signal to the caller.
If you build on a local inference server, enforce payload size yourself. It will not refuse for you.
Source: stress characterization of the resident 120B model, 18 July 2026. Instruments and raw per-request data retained so the campaign is rerunnable after any config change.
The standoff, 30 July 2026
Not a planned benchmark — an incident, and the most instructive record here for anyone about to run several local models at once. Three large models were all enabled as boot-persistent services on one box. They starved each other.
- 81 crash-loop restarts of the 120B service, each failing to allocate 26 GiB, because a 30B model was holding 17.3 GiB and left only 13.7 GiB free.
- Host RAM peaked at 14.7 GiB before an out-of-memory kill, and roughly 18 GiB went phantom — unaccounted memory trapped by 81 killed driver allocations. A reboot was the only thing that cleared it.
- An open port is not a ready model. Health checks that only probed the socket reported success while the model was still loading, or already dying.
- A 120B model leaves roughly 4–5 GiB per card. There is no room for a second tenant. Residency on consumer cards is exclusive and has to be scheduled that way.
Fixed by making the services mutually exclusive at the init-system level, adding start-rate limits and alerting. The eventual topology decision cut the other two models entirely: one model serves every role.
Source: incident trace, dual Arc Pro B70 on Ubuntu, 30 July 2026.
4 · Rebuilt OMEN — the Windows 11 / Vulkan era
Rig: ASUS Pro WS Z890-ACE SE · Intel Core Ultra 9 285K · 128 GB DDR5-4400
· 2× Arc Pro B70 32 GB, ECC off · Windows 11 · Intel driver 32.0.101.8974. Neither B70 drives a
display; the Intel iGPU and ASPEED adapter own the desktop. Campaign: 20–24 August 2026.
Step 5 became the experiment. The cards moved out of the 32 GB host and into a machine with four times the RAM, a new board and CPU, a newer driver, a fresh OS and no display attached to either accelerator. The campaign retained 261 result artifacts, 24 harness files, 42 server logs and a 13,577-sample board-level sensor capture. It was enough of a change to dissolve every old explanation that depended on the host. One of the old limits did not move at all.
The eight-request knee did not move
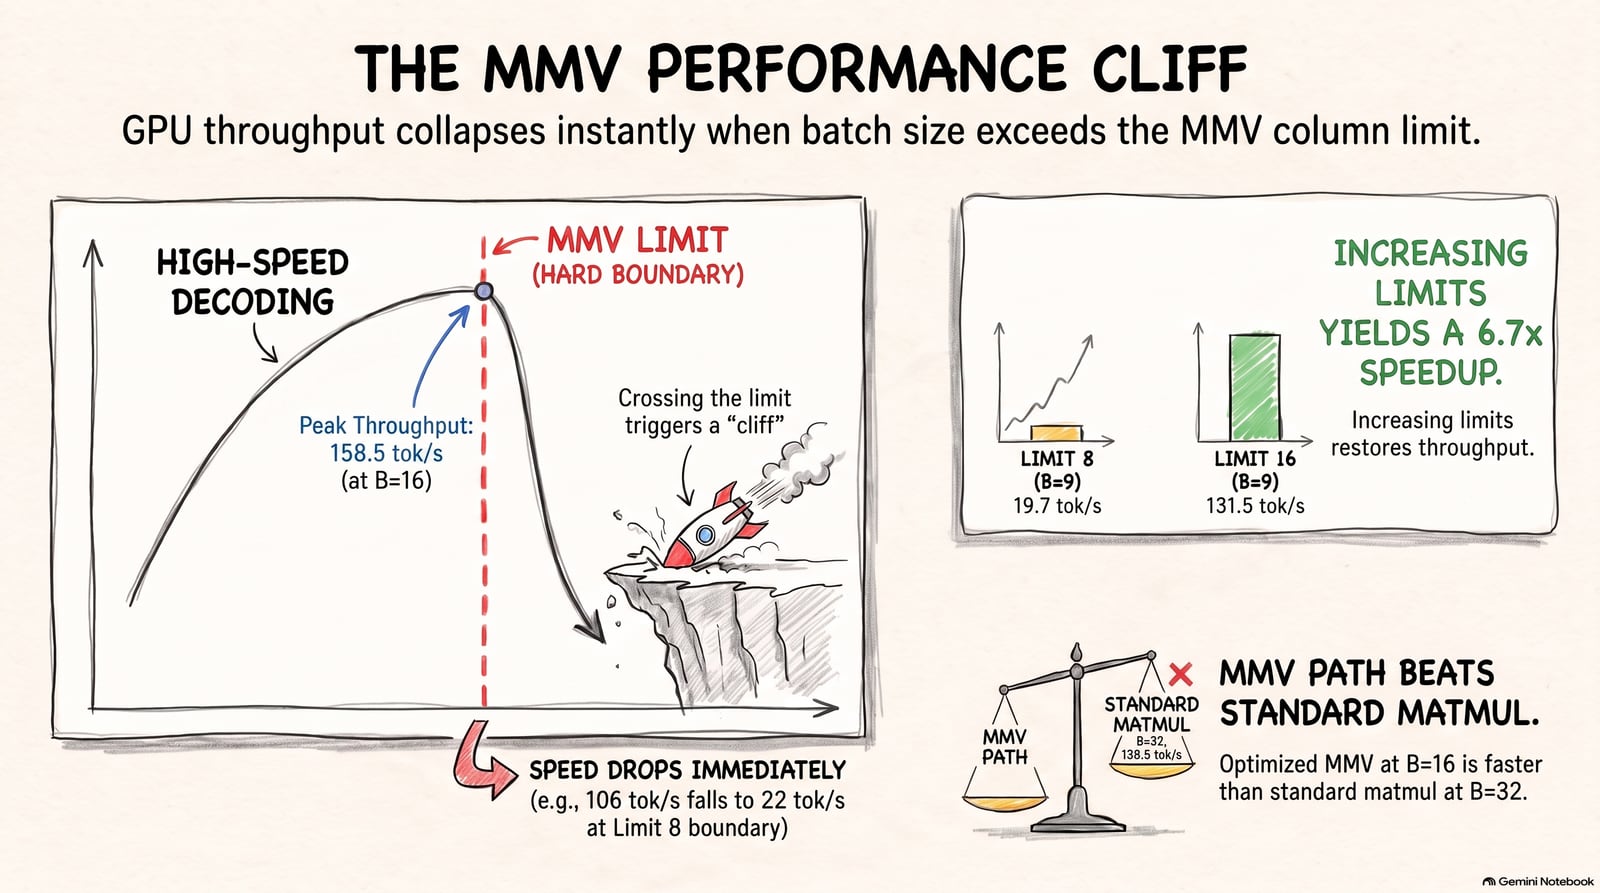
The rebuilt concurrency ladder climbed from 37 tok/s at one slot to 183 tok/s aggregate at eight. At ten it collapsed to about 80 tok/s, while p95 request latency jumped from roughly 6 to 22 seconds. The machine still had 78 GB of commit headroom. A one-card dense-model discriminator reproduced the same boundary, eliminating dual-card traffic, MoE expert routing and host-memory pressure as explanations.
The wall was one Vulkan dispatch constant. In llama.cpp, decode batches of eight or fewer columns
selected a fast matrix-vector kernel. The ninth was accepted, but silently sent the entire batch through a much slower
general matrix-multiply path. Turning that constant into the runtime knob
GGML_VK_MMV_MAX_COLS moved the
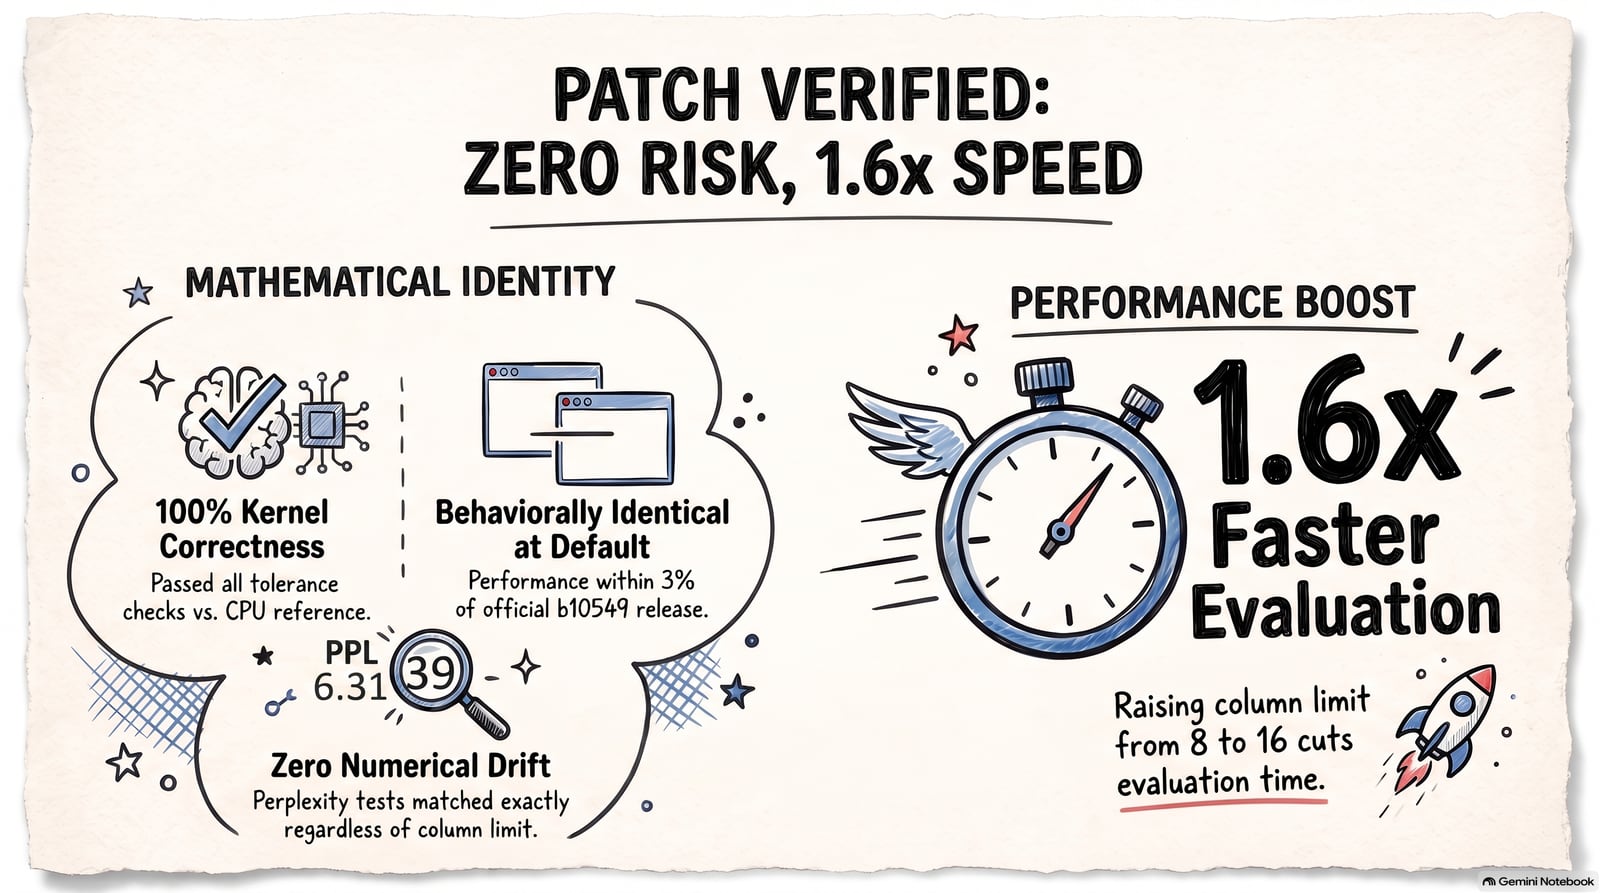
knee on command. On Mistral-24B, ninth-thread aggregate decode went from 19.7 to 131.5 tok/s, a
6.7× gain. Across four dense model families the ninth-thread gain was 6.6–6.9×. Ten real concurrent
requests fell from 204 to 38 seconds median, with per-stream decode rising from 1.3 to 5.4 tok/s. MoE gains were
smaller because expert multiplication uses a separate dispatch gate.
The complete seven-model study, correctness checks, raw data and patch live in the public evidence package; the narrative version is I Upgraded Everything Around the Bottleneck. It Did Not Move. The upstream llama.cpp pull request #27652 remained open as of 27 August 2026.
This did not make the current service 6.7× faster. Its production configuration exposes two deep
slots. The knob changes dispatch only when parallel decode exceeds eight, so it is inert at
-np 2. The
gain is real and causal, but it belongs to a higher-concurrency operating point.
More RAM changed the failure shape, not the need for admission control
The extra memory converted some obvious failures into plausible-looking slow successes. A 70B loaded while commit sat at 92% placed badly and processed prompts at 11.8 tok/s instead of the campaign's 150 tok/s floor. Stopping the co-tenant afterward did not recover it; placement was fixed for the life of the process. Separately, one process configured for four 64k slots silently spilled 10.24 GB into shared memory and lost about 22% throughput. Two 64k slots remained resident.
| Phase | What bound | What the campaign observed |
|---|---|---|
| Load | Commit headroom and placement | A poisoned allocation stayed slow after pressure was removed. |
| Concurrency | Kernel dispatch | The knee stayed at eight until the Vulkan dispatch limit moved. |
| Depth | KV capacity and attention work | Four 64k slots spilled; decode still fell sharply with resident context. |
A post-hoc depth replication supports, but does not upgrade, the older pre-registered result: short-prompt decode was 109.3 tok/s and fell to 6.3 at 57,279 prompt tokens, while prefill fell from 1,404 to 163 tok/s. One identical-prefix reuse observation was 284× cheaper than re-prefill. It is useful corroboration on a changed platform, not a new discovery or a distribution.
Four old configuration rules changed state
| Question | Rebuilt result | Editorial state |
|---|---|---|
| Disable cooperative matrices? | Re-enabling them took pp512 from 720 to 1451/1474 tok/s, with zero display resets over about 6.5 hours. | Old defense retired. |
| Flash attention always loses? | FA-off won by 25–87% below the measured 16k–24k crossover, then hard-hung at greater depth. | Replace with crossover. |
| q8 KV is a 2–4× trap? | Only a 5–6% tax at 32k and 64k on the newer build; the 128k empty result still reproduced. | Stack-specific and superseded. |
| Can Windows serve symmetrically? | Headless B70s delivered 1.85× scaling, 24/24 requests served and zero display resets or hardware errors. | Retraction resolved. |
The card-equality contradiction closed with it. A controlled A/B found the cards within ±1.6%; the old 18% gap tracked the earlier ECC asymmetry. The historical disagreement remains in section 2 because it was honestly unresolved at the time.
The largest model that fits was not the best service
| Model | Single stream | Aggregate | p95 | Operating result |
|---|---|---|---|---|
| Qwen3-30B-A3B | 95.2 tok/s | 116.3 tok/s | 4.1 s | Default service |
| gpt-oss-120b | 14.7 tok/s | ~21.6 tok/s | 25–32 s | Fits at the memory edge; banked, not resident |
| Llama-3.3-70B | 10.7 tok/s | 16.1 tok/s | 21.9 s | Benchmark workload |
The purchasing lesson is not "run the largest model that fits." Active architecture, latency target and memory margin decide whether a fitting model is a useful resident service.
The workstation held several jobs at once
A two-hour combined-load soak produced 847 serving waves at 103.5 tok/s mean and 5.1% coefficient of variation. Vulkan serving retained about 89% of solo speed beside CPU 70B benchmarking and hash-verified disk traffic. A one-hour finale added XPU LoRA training: serving, training, CPU inference and disk copying ran together with zero display resets, hardware errors or unexpected power events. A shorter serving-plus-training A/B measured a 0.99 throughput ratio.
The first thermal result was less reassuring: one card's VRAM reached 94 °C. A cardboard airflow duct cut the sustained peak by about 12 °C; the finale settled around 70 °C VRAM. That is consumer hardware in the literal sense: the software result depended on case airflow, and the fix was measured before it was trusted.
Sources: rebuilt-OMEN limit campaign, 20–24 August 2026; public Vulkan-cliff evidence package. Campaign claims are distilled from retained harness outputs, server logs and board telemetry.
5 · Two Qwen 3.8 models — when the operating point decides the verdict
Rig: the same rebuilt workstation as section 4 — ASUS Pro WS Z890-ACE SE
· Core Ultra 9 285K · 128 GB DDR5 · 2× Arc Pro B70 32 GB, headless · Windows 11 and
Vulkan. A pinned engine build was used for both candidates so the incumbent was never disturbed.
Campaign: 27 August 2026.
Two new models arrived: a dense 27B and a 125B sparse model with 6B active per token whose weights are 88.1 GiB — larger than the box's entire 64 GB of VRAM. The first was run as a gated promotion campaign against the resident MoE. The second could not be a promotion candidate at all, so it was run as a placement study: how does a model that does not fit behave when you slide it across the CPU/GPU boundary one layer at a time?
The gate measured the one prompt length where the candidate loses
The dense 27B lost its promotion decisively and won the same comparison decisively, depending entirely on prompt length. The gate sampled 512-token prompts at sixteen saturated clients, and there the candidate returned 0.69× the incumbent's completed jobs per hour. Moving along the prompt axis, on the same hardware and the same afternoon, it returned 5.49×.
| Prompt length | Incumbent MoE | Dense 27B | Ratio | Which wins |
|---|---|---|---|---|
| 512 tokens | 2316 | 1591 | 0.69× | MoE — decode dominates |
| 8K | 755 | 1983 | 2.63× | Dense |
| 32K | 238 | 1306 | 5.49× | Dense — prefill dominates |
The verdict was do not promote on twelve of fifteen gates, and that is the correct mechanical answer to the question the gate asked. It failed throughput by 31.3% where it needed to gain 25%, and p95 latency at 1.542× against a 1.5× ceiling. It is also an answer about 512-token prompts, which is a claim about the workload that nobody had written down. Where decode dominates, a 3B-active MoE beats a dense 27B doing nine times the arithmetic per token. Where prefill dominates, that reverses.
Quality ran the other way from throughput. Blind pairwise judging, order-reversed and with order-inconsistent pairs discarded, gave the candidate 44 wins, 42 ties and 4 losses — a 95.6% win-or-tie rate against a 60% bar. The deterministic assay reads 0.861 against 0.472, but that gap is inflated and worth correcting here: the incumbent has no vision at all and scores zero on all three vision families. On text-only families the honest comparison is 0.835 against 0.708. A sixty-minute soak at sixteen clients returned 1605 of 1605 valid requests with no system events.
The same crossover, measured the way the rest of this article measures
Completed jobs per hour under sixteen clients is not the number the rest of this article reports, so the two new
models were re-measured single-stream through llama-bench — the harness behind most of the figures
above. The control that makes those rows admissible ran first: the same incumbent model, at the same placement, on
both the production binary and the campaign binary the new models require. They agreed to 0.40%, so
the build is not doing any of the work below.
| Model | pp512 | pp @ 8K | pp @ 32K | tg128 | tg @ 8K | tg @ 32K |
|---|---|---|---|---|---|---|
| Qwen3-30B-A3B MoE, 3B active | 2394.7 | 469.3 | 139.8 | 112.04 | 32.46 | 10.45 |
| Qwen3.8-27B dense | 796.4 | 442.3 | 181.6 | 23.75 | 17.35 | 9.65 |
| Qwen3.8-Flash-Next 125B, 6B active, host-placed | 481.7 | 282.3 | 173.3 | 8.91 | 6.28 | 5.08 |
Read along the rows rather than down the columns. The dense 27B begins 4.7× behind the mixture-of-experts model on generation and 3× behind on prompt processing, and by 32K it has closed to within 8% on generation and overtaken it on prompt processing, 181.6 against 139.8. The 125B model overtakes there too, at 173.3, while remaining the slowest of the three at every generation depth. The ranking at 512 tokens is not the ranking at 32K.
That is the jobs-per-hour inversion again, arrived at from a different direction: a different harness, a different measurement shape, one client instead of sixteen. Two independent routes to the same conclusion is worth more than either alone, and it is the reason this section exists rather than resting on the gate result.
One row in that table is not the same kind of number as the others, and the table does not show it. Every figure above is the mean of three repetitions. For the two models that fit in VRAM those three agree to better than 1.5%, so the mean describes them. Flash-Next's generation repetitions are 7.93, 5.45 and 5.45 tok/s at 8K — a 45% spread, and 19% to 48% across the three depths. The mean is real arithmetic on a series that is not steady.
The direction rules out the obvious explanation. The first repetition is the fastest and the rate then settles lower and stays there, so this is not a cache warming up. Nor is it heat: thermal throttling would punish prompt processing hardest, because that is the compute-bound half, and prompt processing barely moves (4–8%) while generation loses up to 48%. Losing ten times more on the memory-bound half than the compute-bound half is what losing residency looks like — prompt processing amortises a weight fetch over 512 tokens, generation pays it once per token. Flash-Next is the only row here that does not fit in video memory (88.1 GiB of weights against 64 GB of card), and it was the only arm loaded through a memory mapping rather than read into allocated memory.
The placement ladder below prices exactly that, and it says this row is not the model's speed — it is the speed of a half-placed model. Decode on Flash-Next rises monotonically with the number of blocks actually resident on the cards: 7.41 tok/s at sixteen blocks, 9.24 at twenty-four, 27.70 at all forty-eight. The 8.91 above sits between the sixteen- and twenty-four-block rungs. The sweep asked for all forty-eight and did not get them, because a memory mapping leaves the weights on disk to be paged rather than committing them to memory, and the run then slid down that ladder as pages were reclaimed — 9.97 tok/s on the first repetition, 8.4 by the third, about four blocks' worth of residency lost between them.
So the honest reading of the bottom row is not "this model is slow." It is that the same model on the same two cards runs at 8.9 or at 27.7 depending on a load flag, and nothing in a tokens-per-second figure tells you which one you are looking at. That is the entire argument of this article compressed into one row, and it caught the author of the row.
What the measurement itself costs
Two numbers fell out of the sweep that are not about these models at all, and are probably the more useful half for anyone comparing hardware from published figures.
Splitting a model across two cards costs about 7% of generation speed when it would have fit on one.
The incumbent measured 121.18 tok/s on a single card and 112.50 tok/s layer-split across both, same binary, same
harness, same afternoon. The gap shrinks with depth — about 2% at 8K, about 1% at 32K — and prompt
processing is indifferent to placement throughout, varying by under 1.3% in either direction. For a 17.7 GB model on a
32 GB card, the second card buys capacity, not speed. That single-card arm was an accident: llama-bench
reads a comma-separated tensor split as two separate configurations rather than one even split, so the run
landed every layer on one card. It is kept because, paired with the corrected run, it isolates exactly what placement
costs.
The harness is worth about 19% on the fast model and about 3% on the slow one. At matched
placement, llama-bench reports 112.04 tok/s where the server reports 94.4 for the mixture-of-experts
model, but 23.75 against 23.0 for the dense one. That is what a roughly fixed per-request serving cost looks like:
a large share of a fast generation, a small share of a slow one. The practical consequence is that the gap
cannot be subtracted as a constant from someone else's published number — two benchmarks of the same
card can differ by a fifth before any hardware difference enters, and by more or less depending on how fast the model
was to begin with.
The thermal ceiling belongs to one card, not to the pair
Two configurations died at 96 °C, and both times the reading came from VRAM on the same single adapter while its neighbour sat at 86 °C and both GPU cores idled at 77–79 °C. Memory was healthy in both aborts — 56.7 GB of commit headroom free, 1.2 GB shared — so nothing about capacity was involved. The casualties were the placement the campaign had predicted would win, one full model replica per card, which tripped the line at only four concurrent 512-token requests; and the 128K context tier.
At the production operating point the same model then soaked for an hour at sixteen clients and settled at 82 °C. So the ceiling is not a property of running this model, or of these cards as a pair. It belongs to airflow over one specific card, which is the same lesson the cardboard duct taught in section 4, now localised to a single sensor.
An 88 GiB model on 64 GB of VRAM
The 125B sparse model has 48 blocks, 512 experts with ten active per token, and only two key-value heads against twenty-four query heads. It was walked up a placement ladder, moving blocks from CPU to GPU one rung at a time.
| Blocks on GPU | Decode | Valid | Memory |
|---|---|---|---|
| 0 of 48 | 4.75 tok/s | 6/8 | No VRAM; 6.5 GB private commit |
| 8 | 5.99 tok/s | 6/8 | — |
| 16 | 7.40 tok/s | 6/8 | — |
| 24 | 9.12 tok/s | 6/8 | — |
| 32 | 11.62 tok/s | 6/8 | — |
| 40 | 16.69 tok/s | 6/8 | — |
| 48 of 48 | 27.70 tok/s | 6/8 | 61.2 GB VRAM and 65.3 GB private commit |
Two results matter more than the speed curve. The first is that correctness did not move: every rung returned the same six of eight, failing the same two tasks in the same way, with no empty output, no corrupt tokens and no repetition loops anywhere on the ladder. Splitting a model across CPU and GPU changed how fast it answered, not what it answered. Time to first token fell alongside decode, from 27.5 s at no offload to 9.8 s at forty blocks.
The second is the memory bill, and it runs the wrong way. At no offload the process held 6.5 GB of private commit and no VRAM, its weights sitting in evictable file-backed pages. At full offload it held 61.2 GB of VRAM and 65.3 GB of private commit — roughly 126 GB of live memory for a 94 GB model, with both cards at about 95% and one of them pushing 0.93 GB back across the bus into system memory. Offloading to the GPUs did not trade host memory for card memory; it raised both. The per-layer embedding tables never become blocks, so they stay in DDR5 no matter how high the layer count goes. For scale, the resident MoE serves at 94 tok/s on roughly 30 GB of VRAM: the larger model is about 3.4× slower for about four times the memory.
The same flag reverses sign when the model stops fitting. Section 2 records
--no-mmap
taking a 70B's prompt processing from 21.5 to 151.4 tok/s — a 7× win, for a model that fits. For one that
does not, the identical flag is the difference between running and not running: it forces all 88.1 GiB into commit,
and the first attempt died in 41 seconds with 0.76 GB of headroom left. Direct I/O, requested separately, bypasses the
page cache and defeats the memory mapping even when mapping is switched back on, so both had to go. A host-placed model
must page from its mapping. Configuration findings belong to a measured stack and to a memory regime.
Speculative decoding tripled throughput and changed the answers
Multi-token prediction took the dense candidate from 510 to 1591 completed jobs per hour, with draft acceptance climbing from 0.65 to 0.86. It is the single largest configuration win in this campaign, and it is also the one that will not be deployed yet. Speculative decoding is only output-safe when verification is exact: a drafted token is supposed to be accepted only where it matches what the full model would have produced, so at temperature zero the two paths should be byte-identical. They were not. Across every cell compared there were zero identical responses, and all 126 long-prompt requests on the non-speculative path stopped early where the speculative path ran to length. Batch-dependent arithmetic explains some divergence; it does not explain a clean split like that.
The campaign's own compatibility gate had passed this configuration by comparing validity rates between the two paths — 0.875 against 0.875 — and never comparing an output to an output. Equal scores on a rubric are not equivalence.
What a cache miss costs, measured by accident
The campaign contained an unplanned controlled experiment. Its production-shaped runs reuse one filler prompt, so every request after the first hits a warm prefix; its deep-context runs insert a unique retrieval needle, so no request ever does. Same model, same hardware, same 26K depth. With a shared prefix, time to first token went 39.75 s, then 0.13 s, then 0.12 s. With unique prompts it stayed cold at 59.8, 59.6 and 55.4 s. Within the shared-prefix series, the first-to-second-request ratio is about 306× (39.75 / 0.13); the unique-prompt series is a separate comparison. This is the same lever section 3 measured at 68× and section 4 at 284×, now bounded from the other direction.
Sources: Qwen 3.8 promotion campaign and Flash-Next placement study, 27 August 2026. Verdict, scorecard, per-request rows, watchdog telemetry and quarantine records retained; measurements normalised into the cross-harness corpus.
6 · Training on it — LoRA fine-tuning on an Intel card
Rig: one Intel Arc Pro B70, 32 GB · native Windows · PyTorch 2.12.1
with the XPU backend · base model Qwen2.5-Coder-7B. 22 June 2026.
Everything above is about serving models. llama.cpp serves a model; it cannot change one. This is the other half — and it is widely assumed to be unavailable on this hardware.
It got found by accident. A probe meant to assess a different inference engine refuted its own premise: the
environment already had PyTorch's XPU build working on native Windows. Not WSL, not a container
— native. torch.xpu saw the B70, and matrix multiply ran at 150 TFLOPS fp16 and
158 TFLOPS bf16, with the matrix engines engaged and bf16 available — a numeric format the Vulkan
serving path doesn't have. The engine under test was blocked on Windows by packaging, not by any absence
of hardware support. That reframed the whole question and opened the door to training.
The memory ceiling, mapped before trusting it
Before any real run, peak VRAM was swept against sequence length, batch size and gradient checkpointing — to find the envelope deliberately rather than discover it by crashing.
| Sequence · batch · gradient checkpointing | Peak VRAM | Result |
|---|---|---|
| 1024 · 1 · off | 30.3 GiB | fits, barely |
| 2048 · 1 · off | ~45 GiB | out of memory |
| 4096 · 1 · off | ~43 GiB | out of memory |
| 2048 · 4 · off | ~40 GiB | out of memory |
| 4096 · 1 · ON | 27.3 GiB | the working envelope |
| 8192 · 1 · on | ~37 GiB | out of memory |
Gradient checkpointing isn't a tuning knob here, it's a requirement. Without it the 7B runs out of memory by a 2048-token sequence. With it, 4096 tokens at batch size 1 fits in 27.3 GiB with room to spare. Past that you need 4-bit quantized training. Note also that the over-budget runs didn't fail cleanly — they climbed past 32 GiB by spilling into shared system RAM first, the same OS demotion behaviour that haunts the serving side.
The actual fine-tune, and closing the loop
Then a real run inside that envelope: 40.4 million trainable parameters — 0.53% of the model — held-out loss 2.96 to 1.13, training loss 2.33 to 0.91, peak 17.0 GiB, sixty optimizer updates in 108 seconds, producing a 157 MB adapter.
Then the part that makes it a loop rather than a demo. Merge the adapter into the base weights, convert to the serving format (14.2 GB at half precision), quantize to 4-bit (4.36 GB), and hand it to the ordinary Vulkan serving path. It loaded in about six seconds and generated a correct Fibonacci function.
Train on one backend, serve on another, same card. The fine-tuned model re-enters the existing
serving path unchanged — nothing downstream needed to know it had been modified. That's the whole
proposition: a consumer Intel GPU that can both change a model's weights and then serve the result, on Windows,
without a datacenter or a cloud bill.
Two honest limits. This is LoRA, not full fine-tuning — half a percent of the parameters, not all of them. And a 7B is a small model; 14B and up, or longer sequences, need 4-bit training that has not been run. What is proven is that the path exists end to end and the envelope is mapped.
Source: on-rig fine-tuning project, phases 0–4, one Arc Pro B70 on Windows with PyTorch XPU, 22 June 2026.
The serving substrate underneath
Worth a line because it is the connective tissue: partway through, Ollama came off that box in favour of something leaner — its memory overhead was the motivation. A Windows-native Vulkan dual-card substrate that owns config, the exact launch recipe, process lifecycle and structured status, behind a minimal OpenAI-compatible surface. It ran a 30B mixture-of-experts dual-split at 128k context alongside a 14B critic, from June 2026, and it's the direct ancestor of the Linux serving work in section 3.
Its most-earned design decision is one line: readiness means "can serve", not "process is up." Ignoring it produced a production incident on the Linux side five weeks later, when health checks that only probed the socket cheerfully reported success while a model was still loading — or already dying.
Source: dual-B70 Windows Vulkan serving substrate, June 2026. A dozen dated run directories with per-run manifests and telemetry, largely unmined.
7 · Does the output hold up?
Throughput is the easy half. These labs asked whether local models produce good enough output — and ran into a harder problem, which is that when a language model grades the work, you may be measuring the ruler.
The matrix wind tunnel — does self-refinement help?
Six rounds of overnight experiments on idle hardware, planner and critic deliberately running on
different physical boxes: the 30B MoE on the dual-B70 machine, a 30B coder model on the RTX 5070. Each cell
was a combination of planner, critic, prompt archetype, refinement laps and ordering, scored 0–100.
The 192-cell study used qwen3-coder:30b for both the critic and the separate scoring calls.
Different scoring rubrics did not make this an independent-model judge panel.
| Refinement laps | Default rubric | Neutral rubric |
|---|---|---|
| 1 lap | 85.17 | 90.25 |
| 2 laps | 84.25 | 87.42 |
| 3 laps | 84.33 | 89.08 |
| 4 laps | 74.50 | 86.50 |
Round 6 re-judged 192 existing outputs across four prompt arms; it did not generate new answers. The table shows the 48 baseline-arm outputs. Its first-to-fourth-lap drop changes from 10.67 points under the default rubric to 3.75 under the neutral rubric. The score depends strongly on how the judge is instructed. Across all four lap counts, the neutral mean is 88.31 for baseline and 91.40 for concise-author, a 3.08-point difference calculated before rounding.
October 7, 2026 reconciliation: the earlier table paired Round 4 scores with pooled default-rubric scores mislabeled as neutral. A subsequent source check found disagreement between the published per-lap chart and overall summary. The original 192-cell scoring records were then recovered and matched to the original outputs. They support the per-lap series, but give overall neutral means of 88.31 and 91.40, replacing the overview's 88.1 and 90.9 for this cohort. The scrubbed numerical receipt publishes counts, score sums, derived means and source fingerprints; raw prompts, answers and identifiers remain private. No new experiment was run. These are model grades, not human assessments or general reliability rates.
The later repeat-scoring study rated each of those 192 outputs six times. Its mean within-output population standard deviation was about 0.40 points; using sample standard deviation gives about 0.44. The within-output score range across the three rubrics averaged 6.5 points and reached 47. A follow-up sizing calculation used that rubric disagreement as a noise proxy to suggest roughly 19 diverse-rubric votes for its 3.05-point effect. That exploratory estimate did not establish calibrated error bars or a general number of judges required. The measured result motivates checking different rubrics as well as repeatability.
The value here wasn't the answer about laps — that's genuinely "meh". It was that the instrument flagged an effect, corrected it, explained it, and then caught its own measurement bias. Entirely on idle local hardware, overnight, at no marginal cost.
Source: github.com/djcdevelopment/windtunnel — dual Arc Pro B70 plus RTX 5070, 5–10 July 2026.
8 · Local vs cloud — quality, latency, money
The head-to-head (21 July 2026)
A scored documentation and decision-record task, run identically across the local model and two frontier cloud models. Fifteen cells, all successful.
| Where it ran | Model | Mean quality | Mean latency | Marginal cost |
|---|---|---|---|---|
| Local, dual B70 | gpt-oss-120b | 93.8 | 105.2 s | $0.00 |
| Cloud | Gemini 3.1 Pro (preview) | 90.6 | 28.1 s | metered |
| Cloud | Gemini 3.5 Flash | 89.2 | 19.8 s | metered |
The local model won on quality, on two consumer GPUs, at zero marginal cost. The cloud won on latency by 4–5×, and that was the whole of its advantage on this task.
What cloud actually costs (23 July 2026)
A billing audit after standing up a cloud agent that reaches back into the local GPUs across an audited network boundary. The finding was not about tokens. Idle standing infrastructure produced an unexpected $36–38 bill — two managed agent runtimes at roughly $3.50/day each plus a small VM — while actual inference spend was trivial. If you are comparing local against cloud, compare the standing cost, not the per-token rate.
The ledger
Not a lab — the production record. Every model call routed through the local gateway is logged with backend, model, token counts and outcome, so the economics are measured rather than argued.
| Where | Model | Cost class | Calls | Tokens in | Tokens out | Real spend |
|---|---|---|---|---|---|---|
| Local, dual B70 | gpt-oss-120b | sunk | 237 | 326,012 | 140,228 | $0.00 |
| Local, dual B70 | Qwen3-30B-A3B Q4 | sunk | 332 | 36,970 | 15,431 | $0.00 |
| Cloud | Gemini 3.5 Flash | trial credit | 237 | 411,179 | 56,033 | $0.91 |
| Cloud | Gemini 3.1 Pro | trial credit | 185 | 2,022,132 | 150,362 | $5.35 |
618 of those calls landed on already-owned hardware. Every backend listed ran at a 100% success rate.
9 · What is not measured
Stated plainly so nobody cites this for something it doesn't cover.
- A dense 32B on the RTX 5070. Named as an open cell in the capability matrix, never run. The 12 GB verdict for 32B dense is inferred, not measured.
- The 30B MoE on the NVIDIA card. Measured extensively on the B70s, never on the 5070. There is no direct same-model cross-vendor comparison in this corpus.
- Windows against Linux on identical workloads. The two eras used different harnesses. The peer-transfer contrast — 6.48 vs 14.29 GB/s — is the one clean cross-platform number. The throughput figures are not directly comparable.
- The gaming-degradation curve for running worker loads on a gaming rig. Protocol written, human-gated by design — an agent can't play the game.
- No formal output-quality rubric on the NVIDIA lane. Those labs measured throughput and residency only; all the quality scoring ran through the B70 box or the cloud.
- The NPU. Present in the workstation, used by nothing in any stack tested here.
- Full fine-tuning, and anything above 7B. The training result is LoRA — half a percent of the parameters. 14B-and-up, or sequences past 4096, need 4-bit quantized training not yet run.
- A dozen serving-substrate run directories with per-run manifests and telemetry, across three model families at up to 128k context, sitting unread on a drive.
If you're deciding whether to try this
The honest summary is that a 30B-class mixture-of-experts model ran at 95.2 tok/s on the rebuilt dual-card service, while the much larger 120B fit at the memory edge and delivered 14.7 tok/s single-stream. A 70B works too, once the placement flags are right. The output quality is competitive with frontier cloud on real work, and the same hardware can fine-tune as well as serve. The largest model that fits is not automatically the best rung.
Buy enough RAM, but identify the phase before naming the wall. Probe commit and placement before load, enforce admission control at the measured kernel boundary, cache prefixes, and budget KV at depth. Check your own payload sizes too: one server in this record silently truncated an over-limit prompt and reported success. Then build the observation tool before trusting the dashboard — because this platform also reported 5.117 volts and 8.55 gigahertz at idle, and cheerfully meant it.
Cite, inspect, reproduce
This report is meant to be challenged at the operating point where you intend to use it. The public package below separates the claims registry, causal Vulkan result, narrative explanation, and raw demonstration so a correction can name the exact layer it changes.
Open the machine-readable claims registry
Browse the public evidence package
Report a replication or contradiction
Ciula, Derek. “What Consumer Hardware Actually Does.” Steppe Integrations, 5 August 2026, updated 7 October 2026, https://steppeintegrations.com/articles/what-consumer-hardware-actually-does/.
Ran one of these cells on another card, driver, backend, or prompt shape? Open an issue with the model, quantization, build fingerprint, placement, context, concurrency, and raw log. A result that disagrees is more useful here than a vote that agrees.
 Code, raw tables, and reproduction commandsThe versioned Vulkan cliff evidence repository.
 Breaking the Vulkan Ceiling · PDFA portable document for review, download, or a LinkedIn document post.
 The Fake Hardware Wall · videoThe 65 MB visual explanation; the upstream patch is pull request #27652.
Upstream implementation: llama.cpp pull request #27652.